Co-integration and Mean Reverting Portfolio

In the previous post https://statcompute.wordpress.com/2018/07/29/co-integration-and-pairs-trading, it was shown how to identify two co-integrated stocks in the pair trade. In the example below, I will show how to form a mean reverting portfolio with three or more stocks, e.g. stocks with co-integration, and also how to find the linear combination that is stationary for these stocks.

First of all, we downloaded series of three stock prices from finance.yahoo.com.

### GET DATA FROM YAHOO FINANCE
quantmod::getSymbols("FITB", from = "2010-01-01")
FITB <- get("FITB")[, 6]
quantmod::getSymbols("MTB", from = "2010-01-01")
MTB <- get("MTB")[, 6]
quantmod::getSymbols("BAC", from = "2010-01-01")
BAC <- get("BAC")[, 6]

For the residual-based co-integration test, we can utilize the Pu statistic in the Phillips-Ouliaris test to identify the co-integration among three stocks. As shown below, the null hypothesis of no co-integration is rejected, indicating that these three stocks are co-integrated and therefore form a mean reverting portfolio. Also, the test regression to derive the residual for the statistical test is also given.

k <- trunc(4 + (length(FITB) / 100) ^ 0.25)
po.test <- urca::ca.po(cbind(FITB, MTB, BAC), demean = "constant", lag = "short", type = "Pu")
#Value of test-statistic is: 62.7037
#Critical values of Pu are:
#                  10pct    5pct    1pct
#critical values 33.6955 40.5252 53.8731

po.test@testreg
#                     Estimate Std. Error t value Pr(|t|)
#(Intercept)         -1.097465   0.068588  -16.00   <2e-16 ***
#z[, -1]MTB.Adjusted  0.152637   0.001487  102.64   <2e-16 ***
#z[, -1]BAC.Adjusted  0.140457   0.007930   17.71   <2e-16 ***

Based on the test regression output, a linear combination can be derived by [FITB + 1.097465 – 0.152637 * MTB – 0.140457 * BAC]. The ADF test result confirms that the linear combination of these three stocks are indeed stationary.

ts1 <- FITB + 1.097465 - 0.152637 * MTB - 0.140457 * BAC
tseries::adf.test(ts1, k = k)
#Dickey-Fuller = -4.1695, Lag order = 6, p-value = 0.01 

Alternatively, we can also utilize the Johansen test that is based upon the likelihood ratio to identify the co-integration. While the null hypothesis of no co-integration (r = 0) is rejected, the null hypothesis of r <= 1 suggests that there exists a co-integration equation at the 5% significance level.

js.test <- urca::ca.jo(cbind(FITB, MTB, BAC), type = "trace", K = k, spec = "longrun", ecdet = "const")
#          test 10pct  5pct  1pct
#r <= 2 |  3.26  7.52  9.24 12.97
#r <= 1 | 19.72 17.85 19.96 24.60
#r = 0  | 45.88 32.00 34.91 41.07

js.test@V
#                 FITB.Adjusted.l6 MTB.Adjusted.l6 BAC.Adjusted.l6   constant
#FITB.Adjusted.l6        1.0000000        1.000000        1.000000  1.0000000
#MTB.Adjusted.l6        -0.1398349       -0.542546       -0.522351 -0.1380191
#BAC.Adjusted.l6        -0.1916826        1.548169        3.174651 -0.9654671
#constant                0.6216917       17.844653      -20.329085  6.8713179

Similarly, based on the above Eigenvectors, a linear combination can be derived by [FITB + 0.6216917 – 0.1398349 * MTB – 0.1916826 * BAC]. The ADF test result also confirms that the linear combination of these three stocks are stationary.

ts2 <- FITB + 0.6216917 - 0.1398349 * MTB - 0.1916826 * BAC
tseries::adf.test(ts2, k = k)
#Dickey-Fuller = -4.0555, Lag order = 6, p-value = 0.01

Estimating Parameters of A Hyper-Poisson Distribution in SAS

Similar to COM-Poisson, Double-Poisson, and Generalized Poisson distributions discussed in my previous post (https://statcompute.wordpress.com/2016/11/27/more-about-flexible-frequency-models/), the Hyper-Poisson distribution is another extension of the standard Poisson and is able to accommodate both under-dispersion and over-dispersion that are common in real-world problems. Given the complexity of parameterization and computation, the Hyper-Poisson is somewhat under-investigated. To the best of my knowledge, there is no off-shelf computing routine in SAS for the Hyper-Poisson distribution and only a R function available in http://www4.ujaen.es/~ajsaez/hp.fit.r written by A.J. Sáez-Castillo and A. Conde-Sánchez (2013).

The SAS code presented below is the starting point of my attempt on the Hyper-Poisson and its potential applications. The purpose is to replicate the calculation result shown in the Table 6 of “On the Hyper-Poisson Distribution and its Generalization with Applications” by Bayo H. Lawal (2017) (http://www.journalrepository.org/media/journals/BJMCS_6/2017/Mar/Lawal2132017BJMCS32184.pdf). As a result, the parameterization employed in my SAS code will closely follow Bayo H. Lawal (2017) instead of A.J. Sáez-Castillo and A. Conde-Sánchez (2013).


data d1;
  input y n @@;
datalines;
0 121 1 85 2 19 3 1 4 0 5 0 6 1
;
run;

data df;
  set d1;
  where n > 0;
  do i = 1 to n;
    output;
  end;
run;

proc nlmixed data = df;
  parms lambda = 1 beta = 1;
  theta = 1;
  do k = 1 to 100;
    theta = theta + gamma(beta) * (lambda ** k) / gamma(beta + k);
  end;
  prob = (gamma(beta) / gamma(beta + y)) * ((lambda ** y) / theta);
  ll = log(prob);
  model y ~ general(ll);
run;

/*
                     Standard
Parameter  Estimate     Error    DF  t Value  Pr > |t|   Alpha
lambda       0.3752    0.1178   227     3.19    0.0016    0.05
beta         0.5552    0.2266   227     2.45    0.0150    0.05 
*/

As shown, the estimated Lambda = 0.3752 and the estimated Beta = 0.5552 are identical to what is presented in the paper. The next step is be to explore applications in the frequency modeling as well as its value in business cases.

HP

Modeling LGD with Proportional Odds Model

The LGD model is an important component in the expected loss calculation. In https://statcompute.wordpress.com/2015/11/01/quasi-binomial-model-in-sas, I discussed how to model LGD with the quasi-binomial regression that is simple and makes no distributional assumption.

In the real-world LGD data, we usually would observe 3 ordered categories of values, including 0, 1, and in-betweens. In cases with a nontrivial number of 0 and 1 values, the ordered logit model, which is also known as Proportional Odds model, can be applicable. In the demonstration below, I will show how we can potentially use the proportional odds model in the LGD model development.

First of all, we need to categorize all numeric LGD values into three ordinal categories. As shown below, there are more than 30% of 0 and 1 values.

df <- read.csv("lgd.csv")
df$lgd <- round(1 - df$Recovery_rate, 4)
df$lgd_cat <- cut(df$lgd, breaks = c(-Inf, 0, 0.9999, Inf), labels = c("L", "M", "H"), ordered_result = T)
summary(df$lgd_cat)

#   L    M    H 
# 730 1672  143 

The estimation of a proportional odds model is straightforward with clm() in the ordinal package or polr() in the MASS package. As demonstrated below, in addition to the coefficient for LTV, there are 2 intercepts to differentiate 3 categories.

m1 <- ordinal::clm(lgd_cat ~ LTV, data = df)
summary(m1)

#Coefficients:
#    Estimate Std. Error z value Pr(>|z|)    
#LTV   2.0777     0.1267    16.4   <2e-16 ***
#---
#Signif. codes:  0 '***' 0.001 '**' 0.01 '*' 0.05 '.' 0.1 ' ' 1
#
#Threshold coefficients:
#    Estimate Std. Error z value
#L|M  0.38134    0.08676   4.396
#M|H  4.50145    0.14427  31.201

It is important to point out that, in a proportional odds model, it is the cumulative probability that is derived from the linear combination of model variables. For instance, the cumulative probability of LGD belonging to L or M is formulated as

Prob(LGD <= M) = Exp(4.50 – 2.08 * LTV) / (1 + Exp(4.50 – 2.08 * LTV))

Likewise, we would have

Prob(LGD <= L) = Exp(0.38 – 2.08 * LTV) / (1 + Exp(0.38 – 2.08 * LTV))

With above cumulative probabilities, then we can calculate the probability of each category as below.

Prob(LGD = L) = Prob(LGD <= L)
Prob(LGD = M) = Prob(LGD <= M) – Prob(LGD <= L)
Prob(LGD = H) = 1 – Prob(LGD <= M)

The R code is showing the detailed calculation how to convert cumulative probabilities to probabilities of interest.

cumprob_L <- exp(df$LTV * (-m1$beta) + m1$Theta[1]) / (1 + exp(df$LTV * (-m1$beta) + m1$Theta[1])) 
cumprob_M <- exp(df$LTV * (-m1$beta) + m1$Theta[2]) / (1 + exp(df$LTV * (-m1$beta) + m1$Theta[2])) 
prob_L <- cumprob_L
prob_M <- cumprob_M - cumprob_L
prob_H <- 1 - cumprob_M
pred <- data.frame(prob_L, prob_M, prob_H)
apply(pred, 2, mean)

#    prob_L     prob_M     prob_H 
#0.28751210 0.65679888 0.05568903 

After predicting the probability of each category, we would need another sub-model to estimate the conditional LGD for lgd_cat = “M” with either Beta or Simplex regression. (See https://statcompute.wordpress.com/2014/10/27/flexible-beta-modeling and https://statcompute.wordpress.com/2014/02/02/simplex-model-in-r) The final LGD prediction can be formulated as

E(LGD|X)
= Prob(Y = 0|X) * E(Y|X, Y = 0) + Prob(Y = 1|X) * E(Y|X, Y = 1) + Prob(0 < Y < 1|X) * E(Y|X, 0 < Y < 1)
= Prob(Y = 1|X) + Prob(0 < Y < 1|X) * E(Y|X, 0 < Y < 1)

where E(Y|X, 0 < Y < 1) can be calculated from the sub-model.

Model Non-Negative Numeric Outcomes with Zeros

As mentioned in the previous post (https://statcompute.wordpress.com/2017/06/29/model-operational-loss-directly-with-tweedie-glm/), we often need to model non-negative numeric outcomes with zeros in the operational loss model development. Tweedie GLM provides a convenient interface to model non-negative losses directly by assuming that aggregated losses are the Poisson sum of Gamma outcomes, which however might not be well supported empirically from the data generation standpoint.

In examples below, we demonstrated another flexible option, namely Zero-Adjusted (ZA) models, in both scenarios of modeling non-negative numeric outcomes, one with a small number of zeros and the other with a large number of zeros. The basic idea of ZA models is very intuitive and similar to the concept of Hurdle models for count outcomes. In a nutshell, non-negative numeric outcomes can be considered two data generation processes, one for point-mass at zeros and the other governed by a statistical distribution for positive outcomes. The latter could be either Gamma or Inverse Gaussian.

First of all, we sampled down an auto-claim data in a way that only 10 claims are zeros and the rest are all positive. While 10 is an arbitrary choice in the example, other small numbers should show similar results.

pkgs <- list("cplm", "gamlss", "MLmetrics")
lapply(pkgs, require, character.only = T)

data(AutoClaim, package = "cplm")
df1 <- na.omit(AutoClaim)

# SMALL NUMBER OF ZEROS
set.seed(2017)
smp <- sample(seq(nrow(df1[df1$CLM_AMT == 0, ])), size = 10, replace = FALSE)
df2 <- rbind(df1[df1$CLM_AMT > 0, ], df1[df1$CLM_AMT == 0, ][smp, ])

Next, we applied both Tweedie and zero-adjusted Gamma (ZAGA) models to the data with only 10 zero outcomes. It is worth mentioning that ZAGA doesn’t have to be overly complex in this case. As shown below, while we estimated the Gamma Mu parameter with model attributes, the Nu parameter to separate zeros is just a constant with the intercept = -5.4. Both Tweedie and GAZA models gave very similar estimated parameters and predictive measures with MAPE = 0.61.

tw <- cpglm(CLM_AMT ~ BLUEBOOK + NPOLICY, data = df2)
#              Estimate Std. Error t value Pr(>|t|)    
# (Intercept) 8.194e+00  7.234e-02 113.277  < 2e-16 ***
# BLUEBOOK    2.047e-05  3.068e-06   6.671 3.21e-11 ***
# NPOLICY     7.274e-02  3.102e-02   2.345   0.0191 *  

MAPE(df2$CLM_AMT, fitted(tw))
# 0.6053669

zaga0 <- gamlss(CLM_AMT ~ BLUEBOOK + NPOLICY, data = df2, family = "ZAGA")
# Mu Coefficients:
#              Estimate Std. Error t value Pr(>|t|)    
# (Intercept) 8.203e+00  4.671e-02 175.629  < 2e-16 ***
# BLUEBOOK    2.053e-05  2.090e-06   9.821  < 2e-16 ***
# NPOLICY     6.948e-02  2.057e-02   3.377 0.000746 ***
# Nu Coefficients:
#             Estimate Std. Error t value Pr(>|t|)    
# (Intercept)  -5.3886     0.3169     -17   <2e-16 ***

MAPE(df2$CLM_AMT, (1 - fitted(zaga0, what = "nu")) * fitted(zaga0, what = "mu"))
# 0.6053314

In the next case, we used the full data with a large number of zeros in the response and then applied both Tweedie and ZAGA models again. However, in ZAGA model, we estimated two sub-models this time, one for the Nu parameter to separate zeros from non-zeros and the other for the Mu parameter to model non-zero outcomes. As shown below, ZAGA outperformed Tweedie in terms of MAPE due to the advantage that ZAGA is able to explain two data generation schemes separately with different model attributes, which is the capability beyond what Tweedie can provide.

# LARGE NUMBER OF ZEROS
tw <- cpglm(CLM_AMT ~ BLUEBOOK + NPOLICY + CLM_FREQ5 + MVR_PTS + INCOME, data = df1)
#               Estimate Std. Error t value Pr(>|t|)    
# (Intercept)  6.854e+00  1.067e-01  64.241  < 2e-16 ***
# BLUEBOOK     1.332e-05  4.495e-06   2.963  0.00305 ** 
# NPOLICY      4.380e-02  3.664e-02   1.195  0.23196    
# CLM_FREQ5    2.064e-01  2.937e-02   7.026 2.29e-12 ***
# MVR_PTS      1.066e-01  1.510e-02   7.063 1.76e-12 ***
# INCOME      -4.606e-06  8.612e-07  -5.348 9.12e-08 ***

MAPE(df1$CLM_AMT, fitted(tw))
# 1.484484

zaga1 <- gamlss(CLM_AMT ~ BLUEBOOK + NPOLICY, nu.formula = ~(CLM_FREQ5 + MVR_PTS + INCOME), data = df1, family = "ZAGA")
# Mu Coefficients:
#              Estimate Std. Error t value Pr(>|t|)    
# (Intercept) 8.203e+00  4.682e-02 175.218  < 2e-16 ***
# BLUEBOOK    2.053e-05  2.091e-06   9.816  < 2e-16 ***
# NPOLICY     6.948e-02  2.067e-02   3.362 0.000778 ***
# Nu Coefficients:
#               Estimate Std. Error t value Pr(>|t|)    
# (Intercept)  1.153e+00  5.077e-02   22.72   <2e-16 ***
# CLM_FREQ5   -3.028e-01  2.283e-02  -13.26   <2e-16 ***
# MVR_PTS     -1.509e-01  1.217e-02  -12.41   <2e-16 ***
# INCOME       7.285e-06  6.269e-07   11.62   <2e-16 ***

MAPE(df1$CLM_AMT, (1 - fitted(zaga1, what = "nu")) * fitted(zaga1, what = "mu"))
# 1.470228

Given the great flexibility of ZA models, we also have the luxury to explore other candidates than ZAGA. For instance, if the positive part of non-negative outcomes demonstrates a high variance, we can also try a zero-inflated Inverse Gaussian (ZAIG) model, as shown below.

zaig1 <- gamlss(CLM_AMT ~ BLUEBOOK + NPOLICY, nu.formula = ~(CLM_FREQ5 + MVR_PTS + INCOME), data = df1, family = "ZAIG")
# Mu Coefficients:
#              Estimate Std. Error t value Pr(>|t|)    
# (Intercept) 8.205e+00  5.836e-02 140.591  < 2e-16 ***
# BLUEBOOK    2.163e-05  2.976e-06   7.268 3.97e-13 ***
# NPOLICY     5.898e-02  2.681e-02   2.200   0.0278 *  
# Nu Coefficients:
#               Estimate Std. Error t value Pr(>|t|)
# (Intercept)  1.153e+00  5.077e-02   22.72   <2e-16 ***
# CLM_FREQ5   -3.028e-01  2.283e-02  -13.26   <2e-16 ***
# MVR_PTS     -1.509e-01  1.217e-02  -12.41   <2e-16 ***
# INCOME       7.285e-06  6.269e-07   11.62   <2e-16 ***

MAPE(df1$CLM_AMT, (1 - fitted(zaig1, what = "nu")) * fitted(zaig1, what = "mu"))
# 1.469236

Model Operational Losses with Copula Regression

In the previous post (https://statcompute.wordpress.com/2017/06/29/model-operational-loss-directly-with-tweedie-glm), it has been explained why we should consider modeling operational losses for non-material UoMs directly with Tweedie models. However, for material UoMs with significant losses, it is still beneficial to model the frequency and the severity separately.

In the prevailing modeling practice for operational losses, it is often convenient to assume a functional independence between frequency and severity models, which might not be the case empirically. For instance, in the economic downturn, both the frequency and the severity of consumer frauds might tend to increase simultaneously. With the independence assumption, while we can argue that same variables could be included in both frequency and severity models and therefore induce a certain correlation, the frequency-severity dependence and the its contribution to the loss distribution might be overlooked.

In the context of Copula, the distribution of operational losses can be considered a joint distribution determined by both marginal distributions and a parameter measuring the dependence between marginals, of which marginal distributions can be Poisson for the frequency and Gamma for the severity. Depending on the dependence structure in the data, various copula functions might be considered. For instance, a product copula can be used to describe the independence. In the example shown below, a Gumbel copula is considered given that it is often used to describe the positive dependence on the right tail, e.g. high severity and high frequency. For details, the book “Copula Modeling” by Trivedi and Zimmer is a good reference to start with.

In the demonstration, we simulated both frequency and severity measures driven by the same set of co-variates. Both are positively correlated with the Kendall’s tau = 0.5 under the assumption of Gumbel copula.

library(CopulaRegression)
# number of observations to simulate
n <- 100
# seed value for the simulation
set.seed(2017)
# design matrices with a constant column
X <- cbind(rep(1, n), runif(n), runif(n))
# define coefficients for both Poisson and Gamma regressions
p_beta <- g_beta <- c(3, -2, 1)
# define the Gamma dispersion
delta <- 1
# define the Kendall's tau
tau <- 0.5
# copula parameter based on tau
theta <- 1 / (1 - tau)
# define the Gumbel Copula 
family <- 4
# simulate outcomes
out <- simulate_regression_data(n, g_beta, p_beta, X, X, delta, tau, family, zt = FALSE)
G <- out[, 1]
P <- out[, 2]

After the simulation, a Copula regression is estimated with Poisson and Gamma marginals for the frequency and the severity respectively. As shown in the model estimation, estimated parameters with related inferences are different between independent and dependent assumptions.

m <- copreg(G, P, X, family = 4, sd.error = TRUE, joint = TRUE, zt = FALSE)
coef <- c("_CONST", "X1", "X2")
cols <- c("ESTIMATE", "STD. ERR", "Z-VALUE")
g_est <- cbind(m$alpha, m$sd.alpha, m$alpha / m$sd.alpha)
p_est <- cbind(m$beta, m$sd.beta, m$beta / m$sd.beta)
g_est0 <- cbind(m$alpha0, m$sd.alpha0, m$alpha0 / m$sd.alpha0)
p_est0 <- cbind(m$beta0, m$sd.beta0, m$beta0 / m$sd.beta0)
rownames(g_est) <- rownames(g_est0) <- rownames(p_est) <- rownames(p_est0) <- coef
colnames(g_est) <- colnames(g_est0) <- colnames(p_est) <- colnames(p_est0) <- cols

# estimated coefficients for the Gamma regression assumed dependence 
print(g_est)
#          ESTIMATE  STD. ERR   Z-VALUE
# _CONST  2.9710512 0.2303651 12.897141
# X1     -1.8047627 0.2944627 -6.129003
# X2      0.9071093 0.2995218  3.028526

# estimated coefficients for the Gamma regression assumed dependence 
print(p_est)
#         ESTIMATE   STD. ERR   Z-VALUE
# _CONST  2.954519 0.06023353  49.05107
# X1     -1.967023 0.09233056 -21.30414
# X2      1.025863 0.08254870  12.42736

# estimated coefficients for the Gamma regression assumed independence 
# should be identical to GLM() outcome
print(g_est0)
#         ESTIMATE  STD. ERR   Z-VALUE
# _CONST  3.020771 0.2499246 12.086727
# X1     -1.777570 0.3480328 -5.107478
# X2      0.905527 0.3619011  2.502140

# estimated coefficients for the Gamma regression assumed independence 
# should be identical to GLM() outcome
print(p_est0)
#         ESTIMATE   STD. ERR   Z-VALUE
# _CONST  2.939787 0.06507502  45.17536
# X1     -2.010535 0.10297887 -19.52376
# X2      1.088269 0.09334663  11.65837

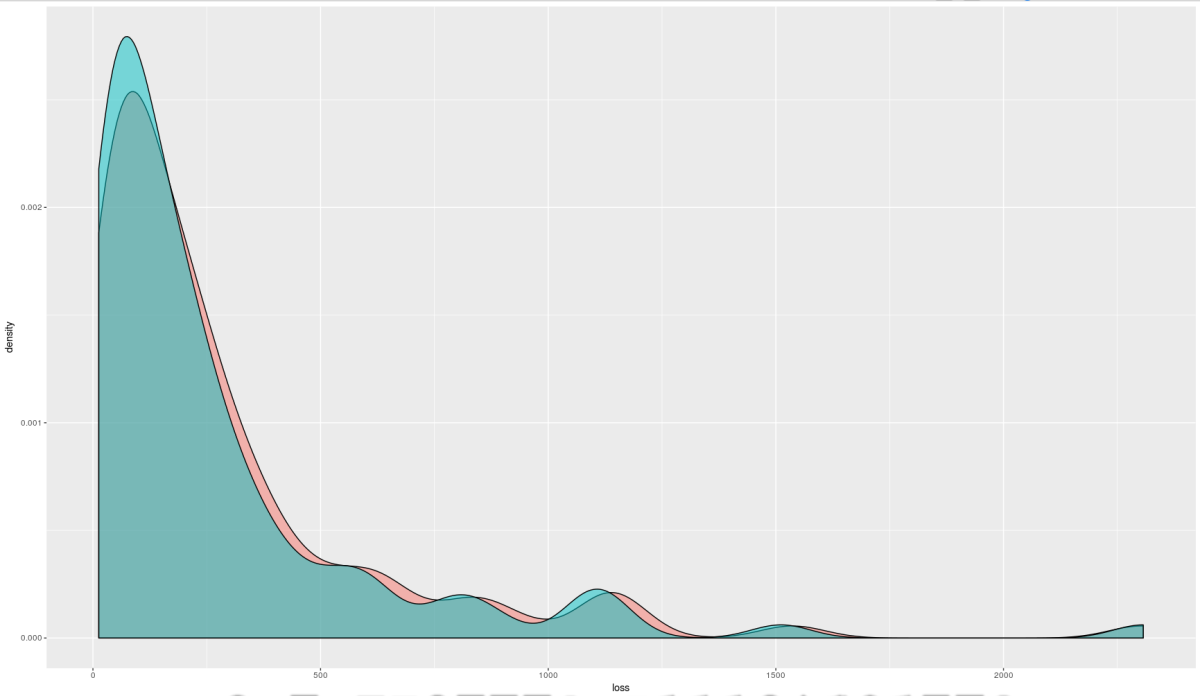
If we compare conditional loss distributions under different dependence assumptions, it shows that the predicted loss with Copula regression tends to have a fatter right tail and therefore should be considered more conservative.

df <- data.frame(g = G, p = P, x1 = X[, 2], x2 = X[, 3])
glm_p <- glm(p ~ x1 + x2, data = df, family = poisson(log))
glm_g <- glm(g ~ x1 + x2, data = df, family = Gamma(log))
loss_dep <- predict(m, X, X, independence = FALSE)[3][[1]][[1]]
loss_ind <- fitted(glm_p) * fitted(glm_g)
den <- data.frame(loss = c(loss_dep, loss_ind), lines = rep(c("DEPENDENCE", "INDEPENDENCE"), each = n))
ggplot(den, aes(x = loss, fill = lines)) + geom_density(alpha = 0.5)

loss2

Prediction Intervals for Poisson Regression

Different from the confidence interval that is to address the uncertainty related to the conditional mean, the prediction interval is to accommodate the additional uncertainty associated with prediction errors. As a result, the prediction interval is always wider than the confidence interval in a regression model. In the context of risk modeling, the prediction interval is often used to address the potential model risk due to aforementioned uncertainties.

While calculating prediction interval of OLS regression based on the Gaussian distributional assumption is relatively straightforward with the off-shelf solution in R, it could be more complicated in a Generalized Linear Model, e.g. Poisson regression. In this post, I am going to show two empirical methods, one based on bootstrapping and the other based on simulation, calculating the prediction interval of a Poisson regression. Because of the high computing cost, the parallelism with foreach() function will be used to improve the efficiency.

First of all, let’s estimate a Poisson regression with glm() and generate a couple fake new data points to calculate model predictions. Since the toy data is very small with only 32 records with all categorical predictors, I doubled the sample size by rbind() to ensure the appropriate data coverage in the bootstrapping.

pkgs <- c('doParallel', 'foreach')
lapply(pkgs, require, character.only = T)
registerDoParallel(cores = 4)

data(AutoCollision, package = "insuranceData")
df <- rbind(AutoCollision, AutoCollision)
mdl <- glm(Claim_Count ~ Age + Vehicle_Use, data = df, family = poisson(link = "log"))
new_fake <- df[1:5, 1:2]

The first method shown below is based on the bootstrapping with following steps:

1. Bootstrapped the original model development sample by the random sample with replacements;

2. Repeated the above many times, e.g. 1000, to generate different bootstrapped samples;

3. Refitted models with bootstrapped samples;

4. Generated predictions with new data points, e.g. “new_fake”, but with refitted models;

5. Generated random numbers based on Poisson distribution with the mean, e.g. lambda, equal to the predicted values from refitted models

6. Collected all Poisson random numbers from the previous step and calculated the percentiles.

boot_pi <- function(model, pdata, n, p) {
  odata <- model$data
  lp <- (1 - p) / 2
  up <- 1 - lp
  set.seed(2016)
  seeds <- round(runif(n, 1, 1000), 0)
  boot_y <- foreach(i = 1:n, .combine = rbind) %dopar% {
    set.seed(seeds[i])
    bdata <- odata[sample(seq(nrow(odata)), size = nrow(odata), replace = TRUE), ]
    bpred <- predict(update(model, data = bdata), type = "response", newdata = pdata)
    rpois(length(bpred), lambda = bpred)
  }
  boot_ci <- t(apply(boot_y, 2, quantile, c(lp, up)))
  return(data.frame(pred = predict(model, newdata = pdata, type = "response"), lower = boot_ci[, 1], upper = boot_ci[, 2]))
}

boot_pi(mdl, new_fake, 1000, 0.95)
#      pred lower upper
#1 12.63040     6    21
#2 38.69738    25    55
#3 26.97271    16    39
#4 10.69951     4    18
#5 52.50839    35    70

The second method is based on the simulation and outlined as below:

1. Re-produced the model response variable, e.g. Claim_Count, by simulating Poisson random numbers with lambda equal to predicted values from the original model;

2. Repeated the above simulations many times, e.g. 1000, to generate many response series;

3. Generated 1000 updated model samples by replacing the original response with the new response generated from simulations;

4. Refitted models with these updated samples

5. Generated predictions with new data points, e.g. “new_fake”, but with refitted models;

6. Generated Poisson random numbers with lambda equal to the predicted values from refitted models

7. Collected all Poisson random numbers from the previous step and calculated the percentiles.

sim_pi <- function(model, pdata, n, p) {
  odata <- model$data
  yhat <- predict(model, type = "response")
  lp <- (1 - p) / 2
  up <- 1 - lp
  set.seed(2016)
  seeds <- round(runif(n, 1, 1000), 0)
  sim_y <- foreach(i = 1:n, .combine = rbind) %dopar% {
    set.seed(seeds[i])
    sim_y <- rpois(length(yhat), lambda = yhat)
    sdata <- data.frame(y = sim_y, odata[names(model$x)])
    refit <- glm(y ~ ., data = sdata, family = poisson)
    bpred <- predict(refit, type = "response", newdata = pdata)
    rpois(length(bpred),lambda = bpred)
  }
  sim_ci <- t(apply(sim_y, 2, quantile, c(lp, up)))
  return(data.frame(pred = predict(model, newdata = pdata, type = "response"), lower = sim_ci[, 1], upper = sim_ci[, 2]))
}

sim_pi(mdl, new_fake, 1000, 0.95)
#      pred lower upper
#1 12.63040     6    21
#2 38.69738    26    52
#3 26.97271    17    39
#4 10.69951     4    18
#5 52.50839    38    68

As demonstrated above, after a large number of replications, outcomes from both methods are highly consistent.

Modeling Frequency in Operational Losses with Python

Poisson and Negative Binomial regressions are two popular approaches to model frequency measures in the operational loss and can be implemented in Python with the statsmodels package as below:

In [1]: import pandas as pd

In [2]: import statsmodels.api as sm

In [3]: import statsmodels.formula.api as smf

In [4]: df = pd.read_csv(&quot;AutoCollision.csv&quot;)

In [5]: # FITTING A POISSON REGRESSION

In [6]: poisson = smf.glm(formula = &quot;Claim_Count ~ Age + Vehicle_Use&quot;, data = df, family = sm.families.Poisson(sm.families.links.log))

In [7]: poisson.fit().summary()
Out[7]:
&lt;class 'statsmodels.iolib.summary.Summary'&gt;
&quot;&quot;&quot;
                 Generalized Linear Model Regression Results
==============================================================================
Dep. Variable:            Claim_Count   No. Observations:                   32
Model:                            GLM   Df Residuals:                       21
Model Family:                 Poisson   Df Model:                           10
Link Function:                    log   Scale:                             1.0
Method:                          IRLS   Log-Likelihood:                -204.40
Date:                Tue, 08 Dec 2015   Deviance:                       184.72
Time:                        20:31:27   Pearson chi2:                     184.
No. Iterations:                     9
=============================================================================================
                                coef    std err          z      P&gt;|z|      [95.0% Conf. Int.]
---------------------------------------------------------------------------------------------
Intercept                     2.3702      0.110     21.588      0.000         2.155     2.585
Age[T.21-24]                  1.4249      0.118     12.069      0.000         1.193     1.656
Age[T.25-29]                  2.3465      0.111     21.148      0.000         2.129     2.564
Age[T.30-34]                  2.5153      0.110     22.825      0.000         2.299     2.731
Age[T.35-39]                  2.5821      0.110     23.488      0.000         2.367     2.798
Age[T.40-49]                  3.2247      0.108     29.834      0.000         3.013     3.437
Age[T.50-59]                  3.0019      0.109     27.641      0.000         2.789     3.215
Age[T.60+]                    2.6391      0.110     24.053      0.000         2.424     2.854
Vehicle_Use[T.DriveLong]      0.9246      0.036     25.652      0.000         0.854     0.995
Vehicle_Use[T.DriveShort]     1.2856      0.034     37.307      0.000         1.218     1.353
Vehicle_Use[T.Pleasure]       0.1659      0.041      4.002      0.000         0.085     0.247
=============================================================================================
&quot;&quot;&quot;

In [8]: # FITTING A NEGATIVE BINOMIAL REGRESSION

In [9]: nbinom = smf.glm(formula = &quot;Claim_Count ~ Age + Vehicle_Use&quot;, data = df, family = sm.families.NegativeBinomial(sm.families.links.log))

In [10]: nbinom.fit().summary()
Out[10]:
&lt;class 'statsmodels.iolib.summary.Summary'&gt;
&quot;&quot;&quot;
                 Generalized Linear Model Regression Results
==============================================================================
Dep. Variable:            Claim_Count   No. Observations:                   32
Model:                            GLM   Df Residuals:                       21
Model Family:        NegativeBinomial   Df Model:                           10
Link Function:                    log   Scale:                 0.0646089484752
Method:                          IRLS   Log-Likelihood:                -198.15
Date:                Tue, 08 Dec 2015   Deviance:                       1.4436
Time:                        20:31:27   Pearson chi2:                     1.36
No. Iterations:                    11
=============================================================================================
                                coef    std err          z      P&gt;|z|      [95.0% Conf. Int.]
---------------------------------------------------------------------------------------------
Intercept                     2.2939      0.153     14.988      0.000         1.994     2.594
Age[T.21-24]                  1.4546      0.183      7.950      0.000         1.096     1.813
Age[T.25-29]                  2.4133      0.183     13.216      0.000         2.055     2.771
Age[T.30-34]                  2.5636      0.183     14.042      0.000         2.206     2.921
Age[T.35-39]                  2.6259      0.183     14.384      0.000         2.268     2.984
Age[T.40-49]                  3.2408      0.182     17.760      0.000         2.883     3.598
Age[T.50-59]                  2.9717      0.183     16.283      0.000         2.614     3.329
Age[T.60+]                    2.6404      0.183     14.463      0.000         2.283     2.998
Vehicle_Use[T.DriveLong]      0.9480      0.128      7.408      0.000         0.697     1.199
Vehicle_Use[T.DriveShort]     1.3402      0.128     10.480      0.000         1.090     1.591
Vehicle_Use[T.Pleasure]       0.3265      0.128      2.548      0.011         0.075     0.578
=============================================================================================
&quot;&quot;&quot;

Although Quasi-Poisson regressions is not currently supported by the statsmodels package, we are still able to estimate the model with the rpy2 package by using R in the back-end. As shown in the output below, parameter estimates in Quasi-Poisson model are identical to the ones in standard Poisson model. In case that we want a flexible model approach for frequency measures in the operational loss forecast without pursuing more complex Negative Binomial model, Quasi-Poisson regression can be considered a serious contender.

In [11]: # FITTING A QUASI-POISSON REGRESSION

In [12]: import rpy2.robjects as ro

In [13]: from rpy2.robjects import pandas2ri

In [14]: pandas2ri.activate()

In [15]: rdf = pandas2ri.py2ri_pandasdataframe(df)

In [16]: qpoisson = ro.r.glm('Claim_Count ~ Age + Vehicle_Use', data = rdf, family = ro.r('quasipoisson(link = &quot;log&quot;)'))

In [17]: print ro.r.summary(qpoisson)

Coefficients:
                      Estimate Std. Error t value Pr(&gt;|t|)
(Intercept)             2.3702     0.3252   7.288 3.55e-07 ***
Age21-24                1.4249     0.3497   4.074 0.000544 ***
Age25-29                2.3465     0.3287   7.140 4.85e-07 ***
Age30-34                2.5153     0.3264   7.705 1.49e-07 ***
Age35-39                2.5821     0.3256   7.929 9.49e-08 ***
Age40-49                3.2247     0.3202  10.072 1.71e-09 ***
Age50-59                3.0019     0.3217   9.331 6.42e-09 ***
Age60+                  2.6391     0.3250   8.120 6.48e-08 ***
Vehicle_UseDriveLong    0.9246     0.1068   8.660 2.26e-08 ***
Vehicle_UseDriveShort   1.2856     0.1021  12.595 2.97e-11 ***
Vehicle_UsePleasure     0.1659     0.1228   1.351 0.191016
---
Signif. codes:  0 ‘***’ 0.001 ‘**’ 0.01 ‘*’ 0.05 ‘.’ 0.1 ‘ ’ 1

(Dispersion parameter for quasipoisson family taken to be 8.774501)

    Null deviance: 6064.97  on 31  degrees of freedom
Residual deviance:  184.72  on 21  degrees of freedom
AIC: NA

Number of Fisher Scoring iterations: 4

Are These Losses from The Same Distribution?

In Advanced Measurement Approaches (AMA) for Operational Risk models, the bank needs to segment operational losses into homogeneous segments known as “Unit of Measures (UoM)”, which are often defined by the combination of lines of business (LOB) and Basel II event types. However, how do we support whether the losses in one UoM are statistically different from the ones in another UoM? The answer is to test if the losses from various UoMs are distributionally different or equivalent.

Empirically, Kolmogorov-Smirnov (K-S) test is often used to test if two samples are from the same distribution. In the example below, although x and y share the same mean, K-S test still shows a significant result due to different variances.

n <- 300
set.seed(2015)
x <- rnorm(n, 0, 1)
y <- rnorm(n, 0, 1.5)

### 2-SAMPLE DISTRIBUTIONAL COMPARISON ###
ks.test(x, y, alternative = "two.sided")
#         Two-sample Kolmogorov-Smirnov test
#
# data:  x and y
# D = 0.1567, p-value = 0.001268
# alternative hypothesis: two-sided

However, K-S test cannot be generalized to K-sample cases, where K > 2. In such scenario, the univariate coverage test or the more general multivariate MRPP test might be more appropriate. The Blossom package developed by Talbert and Cade (https://www.fort.usgs.gov/products/23735) provides convenient functions implementing both tests, as shown below.

z <- rnorm(n, 0, 2)
df <- data.frame(x = c(x, y, z), g = unlist(lapply(c(1, 2, 3), rep, n)))

### K-SAMPLE DISTRIBUTIONAL COMPARISON ###
# COVERAGE TEST FOR THE UNIVARIATE RESPONSES
library(Blossom)
ctest <- coverage(df$x, df$g)
summary(ctest)
# Results:
#        Observed coverage statistic             :  1.870273
#        Mean of coverage statistic              :  1.774817
#        Estimated variance of coverage statistic:  0.002275862
#        Standard deviation of the variance
#         of the coverage statistic              :  5.108031e-05
#
#        Observed standardized coverage statistic:  2.00093
#        Skewness of observed coverage statistic :  0.08127759
#        Probability (Pearson Type III)
#        of a larger or equal coverage statistic :  0.02484709
#        Probability (Resampled)
#        of a largeror equal coverage statistic  :  0.02475*

# MULTIRESPONSE PERMUTATION PROCEDURE FOR MULTIVARIATE RESPONSES
mtest <- mrpp(x, g, df)
summary(mtest)
# Results:
#        Delta Observed                :  1.676303
#        Delta Expected                :  1.708194
#        Delta Variance                :  4.262303e-06
#        Delta Skewness                :  -1.671773
#
#        Standardized test statistic   :  -15.44685
#        Probability (Pearson Type III)
#        of a smaller or equal delta   :  9.433116e-09***

To Difference or Not To Difference?

In the textbook of time series analysis, we’ve been taught to difference the time series in order to have a stationary series, which can be justified by various plots and statistical tests.

In the real-world time series analysis, things are not always as clear as shown in the textbook. For instance, although the ACF plot shows a not-so-slow decay pattern, ADF test however can’t reject the null hypothesis of a unit root. In such cases, many analysts might tend to difference the time series to be on the safe side in their view.

However, is it really a safe practice to difference a time series anyway to have a stationary series to model? In the example below, I will show that inappropriately differencing a time series would lead the model development to an undesirable direction.

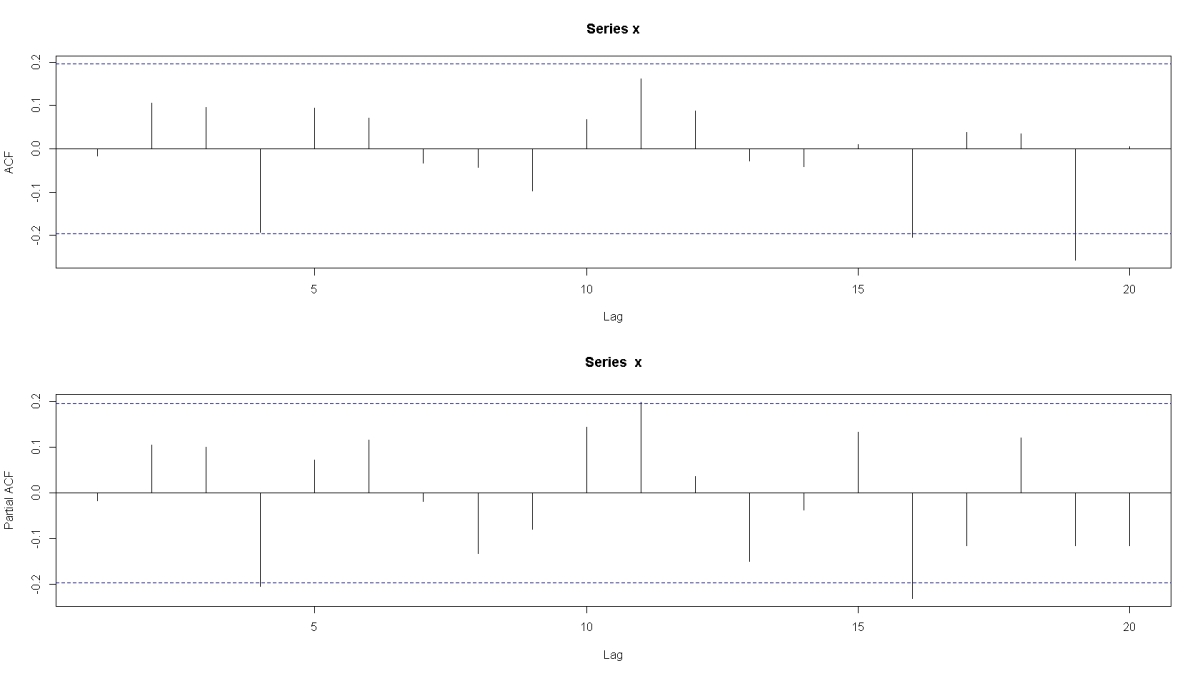
First of all, let’s simulate an univariate series under the Gaussian distributional assumption. By theory, this series has to be stationary.

x_acf

> library(urca)
> library(forecast)
> library(normwhn.test)
> x <- rnorm(100)
> par(mfrow = c(2, 1))
> acf(x)
> pacf(x)
> whitenoise.test(x)
[1] "no. of observations"
[1] 100
[1] "T"
[1] 50
[1] "CVM stat MN"
[1] 0.8687478
[1] "tMN"
[1] -0.9280931
[1] "test value"
[1] 0.6426144
> x.adf <- ur.df(x, type = c("none"), selectlags = "BIC")
> summary(x.adf)

############################################### 
# Augmented Dickey-Fuller Test Unit Root Test # 
############################################### 

Test regression none 


Call:
lm(formula = z.diff ~ z.lag.1 - 1 + z.diff.lag)

Residuals:
     Min       1Q   Median       3Q      Max 
-1.75385 -0.60585 -0.03467  0.61702  3.10100 

Coefficients:
            Estimate Std. Error t value Pr(>|t|)    
z.lag.1    -1.008829   0.143635  -7.024  3.1e-10 ***
z.diff.lag  0.002833   0.101412   0.028    0.978    
---
Signif. codes:  0 ‘***’ 0.001 ‘**’ 0.01 ‘*’ 0.05 ‘.’ 0.1 ‘ ’ 1

Residual standard error: 0.9501 on 96 degrees of freedom
Multiple R-squared:  0.5064,    Adjusted R-squared:  0.4961 
F-statistic: 49.25 on 2 and 96 DF,  p-value: 1.909e-15

Value of test-statistic is: -7.0235 

Critical values for test statistics: 
     1pct  5pct 10pct
tau1 -2.6 -1.95 -1.61

> x.pkss <- ur.kpss(x, type = "mu", lags = "short")
> summary(x.pkss)

####################### 
# KPSS Unit Root Test # 
####################### 

Test is of type: mu with 4 lags. 

Value of test-statistic is: 0.4136 

Critical value for a significance level of: 
                10pct  5pct 2.5pct  1pct
critical values 0.347 0.463  0.574 0.739

> auto.arima(x, ic = 'bic')
Series: x 
ARIMA(0,0,0) with zero mean     

sigma^2 estimated as 0.8829:  log likelihood=-135.67
AIC=273.34   AICc=273.38   BIC=275.94

As shown in the above output:
1) Since x is simulated with the normal assumption, the series should be a white noise by definition.
2) ACF plot shows no auto-correlation at all, as it should.
3) In ADF test, the null hypothesis of unit root is rejected.
4) In PKSS test, the null hypothesis of stationarity is not rejected.
5) The output from auto.arima() suggests an ARIMA(0, 0, 0) model, which is completely in line with the assumption.

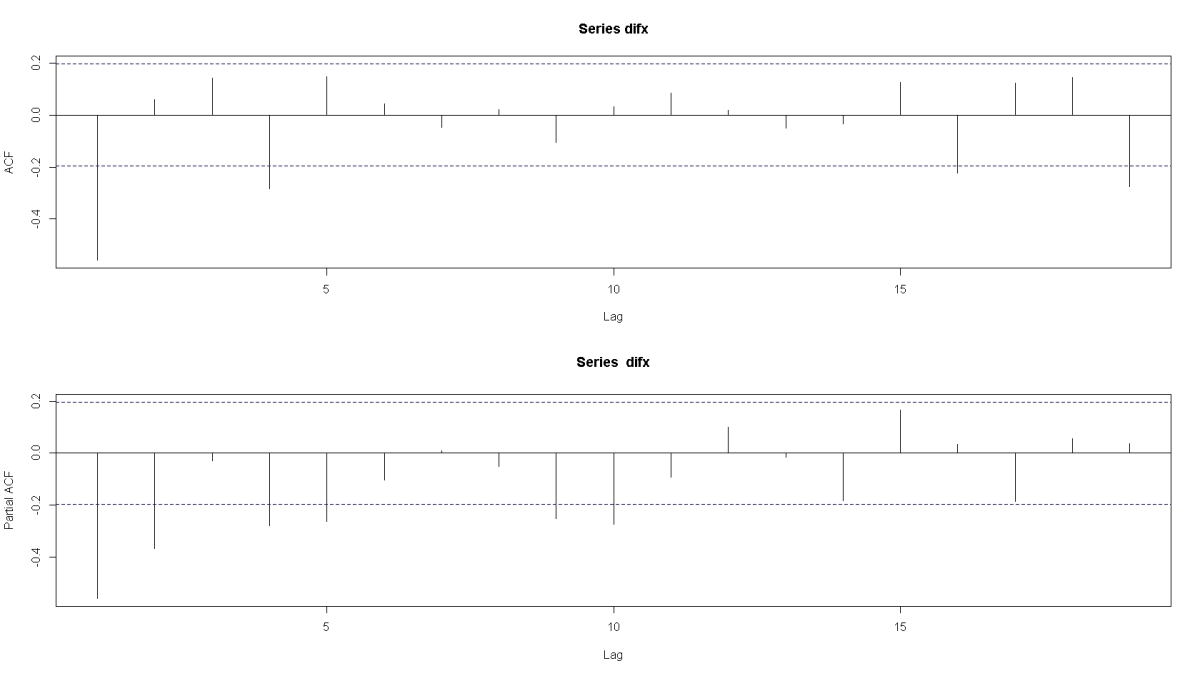
However, what would happen if we take the difference of x anyway?
difx_acf

> difx <- diff(x)
> par(mfrow = c(2, 1))
> acf(difx)
> pacf(difx)
> whitenoise.test(difx)
[1] "no. of observations"
[1] 99
[1] "T"
[1] 49
[1] "CVM stat MN"
[1] 1.669876
[1] "tMN"
[1] 4.689132
[1] "test value"
[1] 0.01904923
> auto.arima(difx, ic = 'bic')
Series: difx 
ARIMA(0,0,1) with zero mean     

Coefficients:
          ma1
      -0.9639
s.e.   0.0327

sigma^2 estimated as 0.901:  log likelihood=-136.64
AIC=277.27   AICc=277.4   BIC=282.46

The above output is quite interesting in a way that we just artificially “created” a model by over-differencing the white noise series.
1) After over-differenced, the series is not a white noise anymore with the null hypothesis rejected, e.g. p-value = 0.02.
2) In addition, the auto.arima() suggests that an ARIMA(0, 0, 1) model might fit the data.

A SAS Macro for Scorecard Evaluation with Weights

On 09/28/2012, I posted a SAS macro evaluation the scorecard performance, e.g. KS / AUC statistics (https://statcompute.wordpress.com/2012/09/28/a-sas-macro-for-scorecard-performance-evaluation). However, this macro is not generic enough to handle cases with a weighting variable. In a recent project that I am working on, there is a weight variable attached to each credit applicant due to the reject inference. Therefore, there is no excuse for me to continue neglecting the necessity of developing another SAS macro that can take care of the weight variable with any positive values in the scorecard evaluation. Below is a quick draft of the macro. You might have to tweak it a little to suit your needs in the production.

%macro wt_auc(data = , score = , y = , weight = );
***********************************************************;
* THE MACRO IS TO EVALUATE THE SEPARATION POWER OF A      *;
* SCORECARD WITH WEIGHTS                                  *;
* ------------------------------------------------------- *;
* PARAMETERS:                                             *;
*  DATA  : INPUT DATASET                                  *;
*  SCORE : SCORECARD VARIABLE                             *;
*  Y     : RESPONSE VARIABLE IN (0, 1)                    *;
*  WEIGHT: WEIGHT VARIABLE WITH POSITIVE VALUES           *; 
* ------------------------------------------------------- *;
* OUTPUTS:                                                *;
*  A SUMMARY TABLE WITH KS AND AUC STATISTICS             *;
* ------------------------------------------------------- *;
* CONTACT:                                                *;
*  WENSUI.LIU@53.COM                                      *;
***********************************************************;
options nocenter nonumber nodate mprint mlogic symbolgen
        orientation = landscape ls = 125 formchar = "|----|+|---+=|-/\<>*";

data _tmp1 (keep = &score &y &weight);
  set &data;
  where &score ~= . and &y in (0, 1) and &weight >= 0;
run;

*** CAPTURE THE DIRECTION OF SCORE ***;
ods listing close;
ods output spearmancorr = _cor;
proc corr data = _tmp1 spearman;
  var &y;
  with &score;
run;
ods listing;

data _null_;
  set _cor;
  if &y >= 0 then do;
    call symput('desc', 'descending');
  end;
  else do;
    call symput('desc', ' ');
  end;
run;

proc sql noprint;
create table
  _tmp2 as    
select
  &score                                         as _scr,
  sum(&y)                                        as _bcnt,
  count(*)                                       as _cnt,
  sum(case when &y = 1 then &weight else 0 end)  as _bwt,
  sum(case when &y = 0 then &weight else 0 end)  as _gwt
from
  _tmp1
group by
  &score;

select
  sum(_bwt) into :bsum
from
  _tmp2;
  
select
  sum(_gwt) into :gsum
from
  _tmp2;

select
  sum(_cnt) into :cnt
from
  _tmp2;    
quit;
%put &cnt;

proc sort data = _tmp2;
  by &desc _scr;
run;

data _tmp3;
  set _tmp2;
  by &desc _scr;
  retain _gcum _bcum _cntcum;
  _gcum + _gwt;
  _bcum + _bwt;
  _cntcum + _cnt;
  _gpct = _gcum / &gsum;
  _bpct = _bcum / &bsum;
  _ks   = abs(_gpct - _bpct) * 100;
  _rank = int(_cntcum / ceil(&cnt / 10)) + 1;
run;

proc sort data = _tmp3 sortsize = max;
  by _gpct _bpct;
run;

data _tmp4;
  set _tmp3;
  by _gpct _bpct;
  if last._gpct then do;
    _idx + 1;
    output;
  end;
run;

proc sql noprint;
create table
  _tmp5 as
select
  a._gcum as gcum,
  (b._gpct - a._gpct) * (b._bpct + a._bpct) / 2 as dx
from
  _tmp4 as a, _tmp4 as b
where
  a._idx + 1 = b._idx;

select
  sum(dx) format = 15.8 into :AUC
from
  _tmp5;

select
  max(_ks) format = 15.8 into :KS_STAT
from
  _tmp3;

select
  _scr format = 6.2 into :KS_SCORE
from
  _tmp3
where
  _ks = (select max(_ks) from _tmp3);

create table
  _tmp6 as
select
  _rank                       as rank,
  min(_scr)                   as min_scr,
  max(_scr)                   as max_scr,
  sum(_cnt)                   as cnt,
  sum(_gwt + _bwt)            as wt,
  sum(_gwt)                   as gwt,
  sum(_bwt)                   as bwt,
  sum(_bwt) / calculated wt   as bad_rate
from
  _tmp3
group by
  _rank;    
quit;  

proc report data = _last_ spacing = 1 split = "/" headline nowd;
  column("GOOD BAD SEPARATION REPORT FOR %upcase(%trim(&score)) IN DATA %upcase(%trim(&data))/
          MAXIMUM KS = %trim(&ks_stat) AT SCORE POINT %trim(&ks_score) and AUC STATISTICS = %trim(&auc)/ /"
          rank min_scr max_scr cnt wt gwt bwt bad_rate);
  define rank       / noprint order order = data;
  define min_scr    / "MIN/SCORE"             width = 10 format = 9.2        analysis min center;
  define max_scr    / "MAX/SCORE"             width = 10 format = 9.2        analysis max center;
  define cnt        / "RAW/COUNT"             width = 10 format = comma9.    analysis sum;
  define wt         / "WEIGHTED/SUM"          width = 15 format = comma14.2  analysis sum;
  define gwt        / "WEIGHTED/GOODS"        width = 15 format = comma14.2  analysis sum;
  define bwt        / "WEIGHTED/BADS"         width = 15 format = comma14.2  analysis sum;
  define bad_rate   / "BAD/RATE"              width = 10 format = percent9.2 order center;
  rbreak after / summarize dol skip;
run;

proc datasets library = work nolist;
  delete _tmp: / memtype = data;
run;
quit;

***********************************************************;
*                     END OF THE MACRO                    *;
***********************************************************;
%mend wt_auc;

In the first demo below, a weight variable with fractional values is tested.

*** TEST CASE OF FRACTIONAL WEIGHTS ***;
data one;
  set data.accepts;
  weight = ranuni(1);
run;

%wt_auc(data = one, score = bureau_score, y = bad, weight = weight);
/*
                   GOOD BAD SEPARATION REPORT FOR BUREAU_SCORE IN DATA ONE
       MAXIMUM KS = 34.89711721 AT SCORE POINT 678.00 and AUC STATISTICS = 0.73521009

    MIN        MAX            RAW        WEIGHTED        WEIGHTED        WEIGHTED    BAD
   SCORE      SCORE         COUNT             SUM           GOODS            BADS    RATE
 -------------------------------------------------------------------------------------------
    443.00     619.00         539          276.29          153.16          123.13   44.56%
    620.00     644.00         551          273.89          175.00           98.89   36.11%
    645.00     660.00         544          263.06          176.88           86.18   32.76%
    661.00     676.00         555          277.26          219.88           57.38   20.70%
    677.00     692.00         572          287.45          230.41           57.04   19.84%
    693.00     707.00         510          251.51          208.25           43.26   17.20%
    708.00     724.00         576          276.31          243.89           32.42   11.73%
    725.00     746.00         566          285.53          262.73           22.80    7.98%
    747.00     772.00         563          285.58          268.95           16.62    5.82%
    773.00     848.00         546          272.40          264.34            8.06    2.96%
 ========== ========== ========== =============== =============== ===============
    443.00     848.00       5,522        2,749.28        2,203.49          545.79
*/

In the second demo, a weight variable with positive integers is also tested.

*** TEST CASE OF INTEGER WEIGHTS ***;
data two;
  set data.accepts;
  weight = rand("poisson", 20);
run;

%wt_auc(data = two, score = bureau_score, y = bad, weight = weight);
/*
                   GOOD BAD SEPARATION REPORT FOR BUREAU_SCORE IN DATA TWO
       MAXIMUM KS = 35.58884479 AT SCORE POINT 679.00 and AUC STATISTICS = 0.73725030

    MIN        MAX            RAW        WEIGHTED        WEIGHTED        WEIGHTED    BAD
   SCORE      SCORE         COUNT             SUM           GOODS            BADS    RATE
 -------------------------------------------------------------------------------------------
    443.00     619.00         539       10,753.00        6,023.00        4,730.00   43.99%
    620.00     644.00         551       11,019.00        6,897.00        4,122.00   37.41%
    645.00     660.00         544       10,917.00        7,479.00        3,438.00   31.49%
    661.00     676.00         555       11,168.00        8,664.00        2,504.00   22.42%
    677.00     692.00         572       11,525.00        9,283.00        2,242.00   19.45%
    693.00     707.00         510       10,226.00        8,594.00        1,632.00   15.96%
    708.00     724.00         576       11,497.00       10,117.00        1,380.00   12.00%
    725.00     746.00         566       11,331.00       10,453.00          878.00    7.75%
    747.00     772.00         563       11,282.00       10,636.00          646.00    5.73%
    773.00     848.00         546       10,893.00       10,598.00          295.00    2.71%
 ========== ========== ========== =============== =============== ===============
    443.00     848.00       5,522      110,611.00       88,744.00       21,867.00
*/

As shown, the macro works well in both cases. Please feel free to let me know if it helps in your cases.

Disaggregating Annual Losses into Each Quarter

In loss forecasting, it is often necessary to disaggregate annual losses into each quarter. The most simple method to convert low frequency to high frequency time series is interpolation, such as the one implemented in EXPAND procedure of SAS/ETS. In the example below, there is a series of annual loss projections from 2013 through 2016. An interpolation by the natural spline is used to convert the annual losses into quarterly ones.
SAS Code:

data annual;
  input loss year mmddyy8.;
  format year mmddyy8.;
datalines;
19270175 12/31/13
18043897 12/31/14
17111193 12/31/15
17011107 12/31/16
;
run;

proc expand data = annual out = quarterly from = year to = quarter;
  id year;
  convert loss / observed = total method = spline(natural);
run;

proc sql;
select 
  year(year) as year, 
  sum(case when qtr(year) = 1 then loss else 0 end) as qtr1,
  sum(case when qtr(year) = 2 then loss else 0 end) as qtr2,
  sum(case when qtr(year) = 3 then loss else 0 end) as qtr3,
  sum(case when qtr(year) = 4 then loss else 0 end) as qtr4,
  sum(loss) as total
from
  quarterly
group by
  calculated year;
quit;

Output:

    year      qtr1      qtr2      qtr3      qtr4     total

    2013   4868536   4844486   4818223   4738931  19270175
    2014   4560049   4535549   4510106   4438194  18043897
    2015   4279674   4276480   4287373   4267666  17111193
    2016   4215505   4220260   4279095   4296247  17011107

While the mathematical interpolation is easy to implement, it might be difficult to justify and interpret from the business standpoint. In reality, there might be an assumption that the loss trend would follow the movement of macro-economy. Therefore, it might be advantageous to disaggregate annual losses into quarterly ones with the inclusion of one or more economic indicators. This approach can be implemented in tempdisagg package of R language. Below is a demo with the same loss data used above. However, disaggregation of annual losses is accomplished based upon a macro-economic indicator.
R Code:

library(tempdisagg)

loss <- c(19270175, 18043897, 17111193, 17011107)
loss.a <- ts(loss, frequency = 1, start = 2013)

econ <- c(7.74, 7.67, 7.62, 7.48, 7.32, 7.11, 6.88, 6.63, 6.41, 6.26, 6.12, 6.01, 5.93, 5.83, 5.72, 5.59)
econ.q <- ts(econ, frequency = 4, start = 2013)

summary(mdl <- td(loss.a ~ econ.q))
print(predict(mdl))

Output:

Call:
td(formula = loss.a ~ econ.q)

Residuals:
Time Series:
Start = 2013
End = 2016
Frequency = 1
[1]  199753 -234384 -199257  233888

Coefficients:
            Estimate Std. Error t value Pr(>|t|)
(Intercept)  2416610     359064   6.730   0.0214 *
econ.q        308226      53724   5.737   0.0291 *
---
Signif. codes:  0 '***' 0.001 '**' 0.01 '*' 0.05 '.' 0.1 ' ' 1

'chow-lin-maxlog' disaggregation with 'sum' conversion
4 low-freq. obs. converted to 16 high-freq. obs.
Adjusted R-squared: 0.9141      AR1-Parameter:     0 (truncated)
        Qtr1    Qtr2    Qtr3    Qtr4
2013 4852219 4830643 4815232 4772080
2014 4614230 4549503 4478611 4401554
2015 4342526 4296292 4253140 4219235
2016 4302864 4272041 4238136 4198067

In practice, if a simple and flexible solution is desired without the need of interpretation, then the mathematical interpolation might be a good choice. On the other hand, if there is a strong belief that the macro-economy might drive the loss trend, then the regression-based method implemented in tempdisagg package might be preferred. However, in our example, both methods generate extremely similar results.

Another Class of Risk Models

In retail banking, it is a key interest to predict the probability of accounts’ adverse behaviors, such as delinquencies or defaults. A widely accepted practice in the industry is to classify accounts into two groups, the good and the bad, based upon the presence of certain adverse behaviors and then to model this binary outcome with discriminant models, e.g. logistic regression. However, an obvious limitation of discriminant models based upon the binary outcome is that the two-state classification over-simplifies adverse behaviors of accounts. What financially impacts a financial institute are not only the presence of a certain adverse behavior but also the frequency of such behavior.

In the definition of binary outcome, it is important to notice that delinquencies can also be measured directly as the frequency of over-due payments. Therefore, instead of modeling the binary outcome, a more sensible alternative might be to model the frequency of delinquencies within a given valuation horizon. In the statistical content, the genuine model for count outcome, e.g. frequency, is Poisson regression model with probability function

f(Y_i | X_i) = exp(-λ_i) * (λ_i ^ Y_i) / Y_i!, where λ_i = exp(X_i`B)

It is assumed that each observed outcome Y_i is drawn from a Poisson distribution with the conditional mean λ_i on a given covariate vector X_i for case i. In Poisson model, a strong assumption is that the mean is equal to the variance such that E(Y_i | X_i) = Var(Y_i | X_i) = λ_i, which is also known as Equi-Disperson. However, in practice, this Equi-Dispersion assumption is too restrictive for many empirical applications. In real-world count outcomes, the variance often exceeds the mean, namely Over-Dispersion, due to various reasons, such as excess zeroes or long right tail. For instance, in a credit card portfolio, majority of cardholders should have zero delinquency at any point in time, while a few might have more than three. With the similar consequence of heteroskedasticity in a linear regression, Over-Dispersion in a Poisson model will lead to deflated standard errors of parameter estimates and therefore inflated t-statistics. Hence, Poisson model is often inadequate and practically unusable.

Considered a generalization of basic Poisson model, Negative Binomial (NB) model accommodates Over-Dispersion in data by including a dispersion parameter. In a NB model, it is assumed that the conditional mean λ_i for case i is determined not only by the observed heterogeneity explained by the covariate vector X_i but also by the unobserved heterogeneity denoted as ε_i that is independent of X_i such that

λ_i = exp(X_i`B + ε_i) = exp(X_i`B) * exp(ε_i), where exp(ε_i) ~ Gamma(1/α, 1/α)

While there are many variants of NB model, the most common one is NB2 model proposed by Cameron and Trivedi (1966) with probability function

f(Y_i | X_i) = Gamma(Y_i + 1/α) / [Gamma(Y_i + 1) * Gamma(1/α)] * [(1/α) / (1/α + λ_i)] ^ (1/α) * [λ_i / (1/α + λ_i)], where α is the dispersion parameter

For NB2 model, its conditional mean E(Y_i | X_i) is still λ_i, while its variance Var(Y_i | X_i) becomes λ_i + α * λ_i ^ 2. Since both λ_i > 0 and α > 0, the variance must exceed the mean and therefore the issue of Over-Dispersion has been addressed.

A major limitation of standard count data models, such as Poisson and Negative Binomial, is that the data is assumed to be generated by a single process. However, in many cases, it might be more appropriate to assume that the data is governed by two or more processes. For instance, it is believed that risk drivers of the first-time delinquent account might be very different from the ones of an account who had been delinquent for multiple times. From the business standpoint, the assumption of multiple processes is particularly attractive in that it provides the potential to segment the portfolio into two or more sub-groups based upon their delinquent pattern and loan characteristics.

Known as the two-part model, Hurdle Poisson model assumes that count outcomes come from two systematically different processes, a Binomial distribution determining the probability of zero counts and a Truncated-at-Zero Poisson governing positive outcomes. The probability function can be expressed as

for Y_i = 0, f(Y_i | X_i) = θ_i, where θ_i = Prob(Y_i = 0)
for Y_i > 0, f(Y_i | X_i) = (1 – θ_i) * exp(-λ_i) * λ_i ^ Y_i / {[1 – exp(-λ_i)] * Y_i!}, where λ_i = exp(X_i`B)

In the modeling framework, the first process can be analyzed by a logistic regression and the second can be reflected by a Truncated-at-Zero Poisson model. An advantage of Hurdle Model is that it is so flexible as to effectively model both Over-Dispersed data with too many zeroes and Under-Dispersed data with too few zeroes.

Alike to Hurdle model, Zero-Inflated Poisson (ZIP) model is another way to model count outcomes with excess zeroes under the assumption of two components. However, it is slightly different from Hurdle model in the sense that zero outcomes are assumed to come from two different sources, one generating only zero outcomes and the other generating both zero and nonzero outcomes. Specifically, a Binomial distribution decides if an individual is from the Always-Zero or the Not-Always-Zero group and then a standard Poisson distribution describes counts in the Not-always-zero group. The probability function of ZIP model is given as

for Y_i = 0, f(Y_i | X_i) = ω_i + (1 + ω_i) * exp(-λ_i), where ω_i = Prob[Y_i ~ Poisson(λ_i)]
for Y_i > 0, f(Y_i | X_i) = (1 – ω_i) * exp(-λ_i) * λ_i ^ Y_i / Y_i!

With the similar idea to Hurdle model, ZIP model can be represented jointly by two different sub-models as well. A logistic regression is used to separate the Always-Zero group from the Not-Always-Zero group and a basic Poisson model is applied to individuals in the Not-Always-Zero group. From a business prospective, ZIP Model describes an important fact that some not-at-risk accounts are well established such that they will never have financial problems, while the other at-risk ones might have chances to get into troubles during the tough time. Therefore, risk exposures and underlying matrices for accounts with same outcomes at zero count might still be differentiable.

In practice, a sharp dichotomization between at-risk group and not-at-risk group might not be realistic. Even a customer with the good financial condition might be exposed to risks in a certain situation. Therefore, it might make sense to split the whole portfolio into a couple segments with different levels of risk-exposure. A Latent Class Poisson model provides such mechanism by assuming that the population of interest is actually a mixture of S > 1 latent (unobservable) components and each individual is considered a draw from one of these latent groups. The probability function of a Latent Class Poisson model with S = 2 classes can be obtained as

F(Y_i | X_i) = P1_i * exp(-λ1_i) * λ1_i ^ Y_i / Y_i! + P2_i * exp(-λ2_i) * λ2_i ^ Y_i / Y_i!, where P1_i + P2_i = 1

Each latent component in the mixture is assumed to have a different parameter λ_i, which will account for the unobserved heterogeneity in the population. For instance, in the case of S = 2, a portfolio is assumed a mixture between a high risk group and a low risk one. Impacts of predictors are allowed to differ across different latent groups, providing a possibility of more informative and flexible interpretations.

Besides models discussed above, it is also worth to point out that the discrete choice model, such as Logit or Probit, has also been widely used to model count outcomes as well. However, such discrete choice model needs to be based upon sequential or ordered instead of multinomial response, namely ordered Logit.

WoE Macro for LGD Model

WoE (Weight of Evidence) transformation has been widely used in scorecard or PD (Probability of Default) model development with a binary response variable in the retail banking. In SAS Global Forum 2012, Anthony and Naeem proposed an innovative method to employ WoE transformation in LGD (Loss Given Default) model development with the response in the range [0, 1]. Specifically, if an account with LGD = 0.25, then this account will be duplicated 100 times, of which 25 instances will be assigned Y = 1 and the rest 75 instances will be assigned Y = 0. As a result, 1 case with the unity-interval response variable has been converted to 100 cases with the binary response variable. After this conversion, WoE transformation algorithm designed for the binary response can be directly applied to the new dataset with the converted LGD.

Following the logic described by Anthony and Naeem, I did a test run with WoE SAS macro that I drafted by myself and got the following output. In the tested data set, there are totally 36,543 cases with the unity-interval response.

                         MONOTONIC WEIGHT OF EVIDENCE TRANSFORMATION FOR X

   BIN           LOWER           UPPER                        #BADS      BAD                 INFO.           
 LEVEL           LIMIT           LIMIT      #FREQ  PERCENT    (Y=1)     RATE        WOE      VALUE         KS
 ------------------------------------------------------------------------------------------------------------
   001          9.5300         84.7200     406000  11.11%    158036  38.93%     -0.1726     0.0033     1.8904
   002         84.7300         91.9100     406800  11.13%    160530  39.46%     -0.1501     0.0025     3.5410
   003         91.9132         97.3100     405300  11.09%    168589  41.60%     -0.0615     0.0004     4.2202
   004         97.3146        101.8100     406000  11.11%    170773  42.06%     -0.0424     0.0002     4.6894
   005        101.8162        105.2221     406100  11.11%    172397  42.45%     -0.0264     0.0001     4.9821
   006        105.2223        110.1642     406000  11.11%    174480  42.98%     -0.0050     0.0000     5.0376
   007        110.1700        115.7000     406600  11.13%    183253  45.07%      0.0800     0.0007     4.1431
   008        115.7029        123.0886     405500  11.10%    188026  46.37%      0.1324     0.0020     2.6630
   009        123.1100        150.0000     406000  11.11%    198842  48.98%      0.2369     0.0063     0.0000
--------------------------------------------------------------------------------------------------------------                                        
    # TOTAL = 3654300, # BADs(Y=1) = 1574926, OVERALL BAD RATE = 43.0979%, MAX. KS = 5.0376, INFO. VALUE = 0.0154.                                    
--------------------------------------------------------------------------------------------------------------                                        

As shown in the above output, monotonic WoE binning, information value, and KS statistic come out nicely with the only exception that the frequency has been increased by 100 times. From a practical view, the increase in the data size will inevitably lead o the increase in the computing cost, making this binary conversion potentially inapplicable to large data.

After a few tweaks, I drafted a modified version of WoE SAS macro suitable for LGD model with the unity-interval response, as given below.

%macro lgd_nwoe(data = , y = , x = );

***********************************************************;
* THE SAS MACRO IS TO PERFORM UNIVARIATE IMPORTANCE RANK  *;
* ORDER AND MONOTONIC WEIGHT OF EVIDENCE TRANSFORMATION   *;
* FOR NUMERIC ATTRIBUTES IN PRE-MODELING DATA PROCESSING  *;
* FOR LGD MODELS. OUTPUTS ARE SUPPOSED TO BE USED IN A    *;
* FRACTIONAL MODEL WITH LOGIT LINK FUNCTION               *;
* ======================================================= *;
* PAMAMETERS:                                             *;
*  DATA: INPUT SAS DATA TABLE                             *;
*  Y   : CONTINUOUS RESPONSE VARIABLE IN [0, 1] RANGE     *;
*  X   : A LIST OF NUMERIC ATTRIBUTES                     *;
* ======================================================= *;
* OUTPUTS:                                                *;
*  NUM_WOE.WOE: A FILE OF WOE TRANSFORMATION RECODING     *;
*  NUM_WOE.FMT: A FILE OF BINNING FORMAT                  *;
*  NUM_WOE.PUT: A FILE OF PUT STATEMENTS FOR *.FMT FILE   *;
*  NUM_WOE.SUM: A FILE WITH PREDICTABILITY SUMMARY        *;
*  NUM_WOE.OUT: A FILE WITH STATISTICAL DETAILS           *;
*  NUM_WOE.IMP: A FILE OF MISSING IMPUTATION RECODING     *;
* ======================================================= *;
* CONTACT:                                                *;
*  WENSUI.LIU@53.COM                                      *;
***********************************************************;

options nocenter nonumber nodate mprint mlogic symbolgen
        orientation = landscape ls = 125 formchar = "|----|+|---+=|-/\<>*";

*** DEFAULT PARAMETERS ***;

%local maxbin miniv bignum mincor;

%let maxbin = 20;

%let miniv  = 0;

%let mincor = 1;

%let bignum = 1e300;

***********************************************************;
***         DO NOT CHANGE CODES BELOW THIS LINE         ***;
***********************************************************;

*** DEFAULT OUTPUT FILES ***;

* WOE RECODING FILE                     *;
filename woefile "LGD_NWOE.WOE";

* FORMAT FOR BINNING                    *;
filename fmtfile "LGD_NWOE.FMT";

* PUT STATEMENT TO USE FORMAT           *;
filename binfile "LGD_NWOE.PUT";

* KS SUMMARY                            *;
filename sumfile "LGD_NWOE.SUM";
 
* STATISTICAL SUMMARY FOR EACH VARIABLE *;
filename outfile "LGD_NWOE.OUT";

* IMPUTE RECODING FILE                  *;
filename impfile "LGD_NWOE.IMP";

*** A MACRO TO DELETE FILE ***;
%macro dfile(file = );
  data _null_;
    rc = fdelete("&file");
    if rc = 0 then do;
      put @1 50 * "+";
      put "THE EXISTED OUTPUT FILE HAS BEEN DELETED.";
      put @1 50 * "+";
    end;
  run;
%mend dfile;

*** CLEAN UP FILES ***;
%dfile(file = woefile);

%dfile(file = fmtfile);

%dfile(file = binfile);

%dfile(file = sumfile);

%dfile(file = outfile);

%dfile(file = impfile);

*** PARSING THE STRING OF NUMERIC PREDICTORS ***;
ods listing close;
ods output position = _pos1;
proc contents data = &data varnum;
run;

proc sql noprint;
  select
    upcase(variable) into :x2 separated by ' '
  from
    _pos1
  where
    compress(upcase(type), ' ') = 'NUM' and
    index("%upcase(%sysfunc(compbl(&x)))", compress(upcase(variable), ' ')) > 0;


  select
    count(variable) into :xcnt
  from
    _pos1
  where
    compress(upcase(type), ' ') = 'NUM' and
    index("%upcase(%sysfunc(compbl(&x)))", compress(upcase(variable), ' ')) > 0;
quit;

data _tmp1;
  retain &x2 &y &y.2;
  set &data;
  where &Y >= 0 and &y <= 1;
  &y.2 = 1 - &y;
  keep &x2 &y &y.2;
run;

ods output position = _pos2;
proc contents data = _tmp1 varnum;
run;

*** LOOP THROUGH EACH PREDICTOR ***;
%do i = 1 %to &xcnt;
    
  proc sql noprint;
    select
      upcase(variable) into :var
    from
      _pos2
    where
      num= &i;

    select
      count(distinct &var) into :xflg
    from
      _tmp1
    where
      &var ~= .;
  quit;

  proc summary data = _tmp1 nway;
    output out  = _med(drop = _type_ _freq_)
    median(&var) = med nmiss(&var) = mis;
  run;
  
  proc sql;
    select
      med into :median
    from
      _med;

    select
      mis into :nmiss
    from
      _med;

    select 
      case when count(&y) = sum(&y) then 1 else 0 end into :mis_flg1
    from
      _tmp1
    where
      &var = .;

    select
      case when sum(&y) = 0 then 1 else 0 end into :mis_flg2
    from
      _tmp1
    where
      &var = .;
  quit;

  %let nbin = %sysfunc(min(&maxbin, &xflg));

  *** CHECK IF # OF DISTINCT VALUES > 1 ***;
  %if &xflg > 1 %then %do;

    *** IMPUTE MISS VALUE WHEN WOE CANNOT BE CALCULATED ***;
    %if &mis_flg1 = 1 | &mis_flg2 = 1 %then %do;
      data _null_;
        file impfile mod;
        put " ";
        put @3 "*** MEDIAN IMPUTATION OF %TRIM(%UPCASE(&VAR)) (NMISS = %trim(&nmiss)) ***;";
        put @3 "IF %TRIM(%UPCASE(&VAR)) = . THEN %TRIM(%UPCASE(&VAR)) = &MEDIAN;";
      run;

      data _tmp1;
        set _tmp1;
        if &var = . then &var = &median;
      run; 
    %end;      
      
    *** LOOP THROUGH ALL # OF BINS ***;
    %do j = &nbin %to 2 %by -1;
      proc rank data = _tmp1 groups = &j out = _tmp2(keep = &y &var rank &y.2);
        var &var;
        ranks rank;
      run;

      proc summary data = _tmp2 nway missing;
        class rank;
        output out = _tmp3(drop = _type_ rename = (_freq_ = freq))
        sum(&y)   = bad    mean(&y)  = bad_rate mean(&y.2) = good_rate
        min(&var) = minx   max(&var) = maxx;
      run;

      *** CREATE FLAGS FOR MULTIPLE CRITERION ***;
      proc sql noprint;
        select
          case when min(bad_rate) > 0 then 1 else 0 end into :minflg
        from
          _tmp3;

        select
          case when max(bad_rate) < 1 then 1 else 0 end into :maxflg
        from
          _tmp3;              
      quit;

      *** CHECK IF SPEARMAN CORRELATION = 1 ***;
      %if &minflg = 1 & &maxflg = 1 %then %do;
        ods output spearmancorr = _corr(rename = (minx = cor));
        proc corr data = _tmp3 spearman;
          var minx;
          with bad_rate;
        run;

        proc sql noprint;
          select
            case when abs(cor) >= &mincor then 1 else 0 end into :cor
          from
            _corr;
        quit;

        *** IF SPEARMAN CORR = 1 THEN BREAK THE LOOP ***;
        %if &cor = 1 %then %goto loopout;
      %end;
      %else %if &nbin = 2 %then %goto exit;
    %end;

    %loopout:

    *** CALCULATE STATISTICAL SUMMARY ***;
    
    proc sql noprint;
      select 
        sum(freq) into :freq
      from
        _tmp3;
      
      select
        sum(bad) into :bad
      from
        _tmp3;

      select
        sum(bad) / sum(freq) into :lgd
      from
        _tmp3;
    quit;

    proc sort data = _tmp3 sortsize = max;
      by rank;
    run;

    data _tmp4;
      retain bin minx maxx bad freq pct bad_rate good_rate;
      set _tmp3 end = eof;
      by rank;

      if rank = . then bin = 0;
      else do;
        retain b 0;
        bin + 1;
      end;
  
      pct  = freq / &freq;
      bpct = bad / &bad;
      gpct = (freq - bad) / (&freq - &bad);
      woe  = log(bpct / gpct);
      iv   = (bpct - gpct) * woe;
      
      retain cum_bpct cum_gpct;
      cum_bpct + bpct;
      cum_gpct + gpct;
      ks = abs(cum_gpct - cum_bpct) * 100;
      
      retain iv_sum ks_max;
      iv_sum + iv;
      ks_max = max(ks_max, ks);
      if eof then do;
        call symput("bin", put(bin, 4.));
        call symput("ks", put(ks_max, 10.4));
        call symput("iv", put(iv_sum, 10.4));
      end;

      keep bin minx maxx bad freq pct bad_rate
           gpct bpct woe iv cum_gpct cum_bpct ks;
    run;

    *** REPORT STATISTICAL SUMMARY ***;
    proc printto print = outfile;
    run;

    title;
    ods listing;
    proc report data = _tmp4 spacing = 1 split = "*" headline nowindows;
      column(" * MONOTONIC WEIGHT OF EVIDENCE TRANSFORMATION FOR %upcase(%trim(&var))"
             bin minx maxx freq pct bad_rate woe iv ks);

      define bin      /"BIN#"         width = 5  format = z3. order order = data;
      define minx     /"LOWER LIMIT"  width = 15 format = 14.4;
      define maxx     /"UPPER LIMIT"  width = 15 format = 14.4;
      define freq     /"#FREQ"        width = 10 format = 9.;
      define pct      /"DISTRIBUTION" width = 15 format = percent14.4;
      define bad_rate /"MEAN LGD"     width = 15 format = percent14.4;
      define woe      /"WOE"          width = 15 format = 14.8;
      define iv       /"INFO. VALUE"  width = 15 format = 14.8;
      define ks       /"KS"           width = 10 format = 9.4;
      compute after;
        line @1 125 * "-";
        line @10 "# TOTAL = %trim(&freq), AVERAGE LGD = %trim(&lgd), "
                 "MAX. KS = %trim(&ks), INFO. VALUE = %trim(&iv).";
        line @1 125 * "-";    
      endcomp;
    run;
    ods listing close;

    proc printto;
    run;

    proc sql noprint;
      select
        case when sum(iv) >= &miniv then 1 else 0 end into :ivflg
      from
        _tmp4;
    quit;

    *** OUTPUT RECODING FILES IF IV >= &miniv BY DEFAULT ***;
    %if &ivflg = 1 %then %do;
      data _tmp5;
        length upper $20 lower $20;
        lower = compress(put(maxx, 20.4), ' ');

        set _tmp4 end = eof;
        upper = compress(put(maxx, 20.4), ' ');
        if bin = 1 then lower = "-%trim(&bignum)";
        if eof then upper = "%trim(&bignum)";
        w%trim(&var) = compress(put(woe, 12.8), ' ');
      run;

      *** OUTPUT WOE RECODE FILE ***;
      data _null_;
        set _tmp5 end = eof;
        file woefile mod;

        if bin = 0 and _n_ = 1 then do;
          put " ";
          put @3 3 * "*"
                 " WOE RECODE OF %upcase(%trim(&var)) (KS = %trim(&ks), IV = %trim(&iv))"
                 + 1 3 * "*" ";";
          put @3  "if %trim(&var) = . then w%trim(&var) = " w%trim(&var) ";";
        end;
        if bin = 1 and _n_ = 1 then do;
          put " ";
          put @3 3 * "*"
                 " WOE RECODE OF %upcase(%trim(&var)) (KS = %trim(&ks), IV = %trim(&iv))"
                 + 1 3 * "*" ";";
          put @3 "if " lower "< %trim(&var) <= " upper
                 "then w%trim(&var) = " w%trim(&var) ";";
        end;
        if _n_ > 1 then do;
          put @5 "else if " lower "< %trim(&var) <= " upper
                 "then w%trim(&var) = " w%trim(&var) ";";
        end;
        if eof then do;
          put @5 "else w%trim(&var) = 0;";
        end;
      run;

      *** OUTPUT BINNING FORMAT FILE ***;
      data _null_;
        set _tmp5 end = eof;
        file fmtfile mod;

        if bin = 1 then lower = "LOW";
        if eof then upper = "HIGH";

        if bin = 0 and _n_ = 1 then do;
          put " ";
          put @3 3 * "*"
                 " BINNING FORMAT OF %trim(&var) (KS = %trim(&ks), IV = %trim(&IV))"
              + 1 3 * "*" ";";
          put @3 "value %trim(&var)_fmt";
          put @5 ". " @40 " = '" bin: z3.
              @47 ". MISSINGS'";
        end;

            
        if bin = 1 and _n_ = 1 then do;
          put " ";
          put @3 3 * "*"
              @5 "BINNING FORMAT OF %trim(&var) (KS = %trim(&ks), IV = %trim(&IV))"
              + 1 3 * "*" ";";
          put @3 "value %trim(&var)_fmt";
          put @5 lower @15 " - " upper  @40 " = '" bin: z3.
              @47 "." + 1 lower "- " upper "'";
        end;

        if _n_ > 1 then do;
          put @5 lower @15 "<- " upper @40 " = '" bin: z3.
              @47 "." + 1 lower "<- " upper "'";
        end;
        if eof then do;
          put @5 "OTHER" @40 " = '999. OTHERS';";
        end;
      run;

      *** OUTPUT BINNING RECODE FILE ***;
      data _null_;
        file binfile mod;
        put " ";
        put @3 "*** BINNING RECODE of %trim(&var) ***;";
        put @3 "c%trim(&var) = put(%trim(&var), %trim(&var)_fmt.);";
      run;

      *** SAVE SUMMARY OF EACH VARIABLE INTO A TABLE ***;
      %if %sysfunc(exist(work._result)) %then %do;
        data _result;
          format variable $32. bin 3. ks 10.4 iv 10.4;
          if _n_ = 1 then do;
            variable = "%trim(&var)";
            bin      = &bin;
            ks       = &ks;
            iv       = &iv;
            output;
          end;
          set _result;
          output;
        run;
      %end;
      %else %do;
        data _result;
          format variable $32. bin 3. ks 10.4 iv 10.4;
          variable = "%trim(&var)";
          bin      = &bin;
          ks       = &ks;
          iv       = &iv;
        run;        
      %end;
    %end;

    %exit:

    *** CLEAN UP TEMPORARY TABLES ***;
    proc datasets library = work nolist;
      delete _tmp2 - _tmp5 _corr / memtype = data;
    run;
    quit;
  %end;    
%end;

*** SORT VARIABLES BY KS AND OUTPUT RESULTS ***;
proc sort data = _result sortsize = max;
  by descending iv descending ks;
run;

data _null_;
  set _result end = eof;
  file sumfile;

  if _n_ = 1 then do;
    put @1 80 * "-";
    put @1  "| RANK" @10 "| VARIABLE RANKED BY IV" @45 "| # BINS"
        @55 "|  KS"  @66 "| INFO. VALUE" @80 "|";
    put @1 80 * "-";
  end;
  put @1  "| " @4  _n_ z3. @10 "| " @12 variable @45 "| " @50 bin
      @55 "| " @57 ks      @66 "| " @69 iv       @80 "|";
  if eof then do;
    put @1 80 * "-";
  end;
run;

proc datasets library = work nolist;
  delete _result (mt = data);
run;
quit;

*********************************************************;
*                   END OF MACRO                        *;
*********************************************************;

%mend lgd_nwoe;

With this macro, I tested on the same data again but without the binary conversion proposed Anthony and Naeem. The output is also pasted below for the comparison purpose.

                                                                                                                            
                                 MONOTONIC WEIGHT OF EVIDENCE TRANSFORMATION FOR X

  BIN#     LOWER LIMIT     UPPER LIMIT      #FREQ    DISTRIBUTION        MEAN LGD             WOE     INFO. VALUE         KS
 ---------------------------------------------------------------------------------------------------------------------------
   001          9.5300         84.7200       4060       11.1102%        38.9246%      -0.17266201      0.00326518     1.8911
   002         84.7300         91.9100       4068       11.1321%        39.4665%      -0.14992613      0.00247205     3.5399
   003         91.9132         97.3100       4053       11.0910%        41.5962%      -0.06155066      0.00041827     4.2195
   004         97.3146        101.8100       4060       11.1102%        42.0504%      -0.04288377      0.00020368     4.6945
   005        101.8162        105.2221       4061       11.1129%        42.4538%      -0.02634960      0.00007701     4.9867
   006        105.2223        110.1642       4060       11.1102%        42.9896%      -0.00445666      0.00000221     5.0362
   007        110.1700        115.7000       4066       11.1266%        45.0653%       0.07978905      0.00071190     4.1440
   008        115.7029        123.0886       4055       11.0965%        46.3687%       0.13231366      0.00195768     2.6644
   009        123.1100        150.0000       4060       11.1102%        48.9800%       0.23701619      0.00631510     0.0000
-----------------------------------------------------------------------------------------------------------------------------
         # TOTAL = 36543, AVERAGE LGD = 0.430988, MAX. KS = 5.0362, INFO. VALUE = 0.0154.                                    
-----------------------------------------------------------------------------------------------------------------------------

The comparison shows that most information from 2 implementations are almost identical. For instance, information value = 0.0154 in both cases. However, the frequency in the second output reflects the correct sample size, e.g 36,543. As a result, the computation is more efficient and the time consumed is much shorter. Considering the fact that usually hundreds of variables should be looped through this WoE transformation one by one, the approach without duplicating cases and converting to binary might make more practical sense.

A SAS Macro Implementing Bi-variate Granger Causality Test

In loss forecasting, it is often of the interest to know: 1) if a time series, e.g. macro-economic variables, is useful to predict another, e.g. portfolio loss; 2) the number of lags to contribute such predictive power. Granger (1969) proposed that A time series X is said to Granger-cause Y if lagged values of X are able to provide statistically significant information to predict the future values of Y.

A SAS macro below is showing how to implement Granger Causality test in a bi-variate sense.

%macro causal(data = , y = , drivers = , max_lags = );
***********************************************************;
* THIS SAS MACRO IS AN IMPLEMENTATION OF BI-VARIATE       *;
* GRANGER CAUSALITY TEST PROPOSED BY GRANGER (1969)       *;
* ======================================================= *;
* PAMAMETERS:                                             *;
*  DATA     : INPUT SAS DATA TABLE                        *;
*  Y        : A CONTINUOUS TIME SERIES RESPONSE VARIABLE  *;
*  DRIVERS  : A LIST OF TIME SERIES PREDICTORS            *;
*  MAX_LAGS : MAX # OF LAGS TO SEARCH FOR CAUSAL          *;
*             RELATIONSHIPS                               *;
* ======================================================= *;
* CONTACT:                                                *;
*  WENSUI.LIU@53.COM, LOSS FORECASTING & RISK MODELING    *;
***********************************************************;

options nocenter nonumber nodate mprint mlogic symbolgen orientation = landscape 
        ls = 150 formchar = "|----|+|---+=|-/\<>*";

%macro granger(data = , dep = , indep = , nlag = );

%let lag_dep = ;
%let lag_indep = ;

data _tmp1;
  set &data (keep = &dep &indep);

  %do i = 1 %to &nlag;
  lag&i._&dep = lag&i.(&dep);
  lag&i._&indep = lag&i.(&indep);

  %let lag_dep = &lag_dep lag&i._&dep;
  %let lag_indep = &lag_indep lag&i._&indep;
  %end;
run;

proc corr data = _tmp1 noprint outp = _corr1(rename = (&dep = value) where = (_type_ = 'CORR')) nosimple;
  var &dep;
  with lag&nlag._&indep;
run;

proc corr data = _tmp1 noprint outp = _corr2(rename = (&dep = value) where = (_type_ = 'CORR')) nosimple;
  var &dep;
  with lag&nlag._&indep;
  partial lag&nlag._&dep;
run;

proc reg data = _tmp1 noprint;
  model &dep = &lag_dep;
  output out = _rest1 r = rest_e;
run;

proc reg data = _tmp1 noprint;
  model &dep = &lag_dep &lag_indep;
  output out = _full1 r = full_e;
run;

proc sql noprint;
  select sum(full_e * full_e) into :full_sse1 from _full1;

  select sum(rest_e * rest_e) into :rest_sse1 from _rest1;

  select count(*) into :n from _full1;

  select value into :cor1 from _corr1;

  select value into :cor2 from _corr2;
quit;

data _result;
  format dep $20. ind $20.;
  dep   = "&dep";
  ind   = "%upcase(&indep)";
  nlag = &nlag;

  corr1 = &cor1;
  corr2 = &cor2;

  f_test1  = ((&rest_sse1 - &full_sse1) / &nlag) / (&full_sse1 / (&n -  2 * &nlag - 1));
  p_ftest1 = 1 - probf(f_test1, &nlag, &n -  2 * &nlag - 1);

  chisq_test1 = (&n * (&rest_sse1 - &full_sse1)) / &full_sse1;
  p_chisq1    = 1 - probchi(chisq_test1, &nlag);

  format flag1 $3.;
  if max(p_ftest1, p_chisq1) < 0.01 then flag1 = "***";
  else if max(p_ftest1, p_chisq1) < 0.05 then flag1 = " **";
  else if max(p_ftest1, p_chisq1) < 0.1 then flag1 = "  *";
  else flag1 = "   ";
run;

%mend granger;

data _in1;
  set &data (keep = &y &drivers);
run;

%let var_loop = 1;

%do %while (%scan(&drivers, &var_loop) ne %str());

  %let driver = %scan(&drivers, &var_loop);

  %do lag_loop = 1 %to &max_lags;

    %granger(data = _in1, dep = &y, indep = &driver, nlag = &lag_loop);

    %if &var_loop = 1 & &lag_loop = 1 %then %do;
      data _final;
        set _result;
      run;
    %end;
    %else %do;
      data _final;
        set _final _result;
      run;
    %end;
  %end;

  %let var_loop = %eval(&var_loop + 1);
%end;

title;
proc report data  = _last_ box spacing = 1 split = "/" nowd;
  column("GRANGER CAUSALITY TEST FOR %UPCASE(&y) UPTO &MAX_LAGS LAGS"
         ind nlag corr1 corr2 f_test1 chisq_test1 flag1);

  define ind         / "DRIVERS"                width = 20 center group order order = data;
  define nlag        / "LAG"                    width = 3  format = 3.   center order order = data;
  define corr1       / "PEARSON/CORRELATION"    width = 12 format = 8.4  center;
  define corr2       / "PARTIAL/CORRELATION"    width = 12 format = 8.4  center;
  define f_test1     / "CAUSAL/F-STAT"          width = 12 format = 10.4 center;
  define chisq_test1 / "CAUSAL/CHISQ-STAT"      width = 12 format = 10.4 center;
  define flag1       / "CAUSAL/FLAG"            width = 8  right;
run;

%mend causal;

%causal(data = sashelp.citimon, y = RTRR, drivers = CCIUTC LHUR FSPCON, max_lags = 6);

Based upon the output shown below, it is tentative to conclude that LHUR (UNEMPLOYMENT RATE) 3 months early might be helpful to predict RTRR (RETAIL SALES).

 ---------------------------------------------------------------------------------------
 |                     GRANGER CAUSALITY TEST FOR RTRR UPTO 6 LAGS                     |
 |                           PEARSON      PARTIAL       CAUSAL       CAUSAL      CAUSAL|
 |      DRIVERS        LAG CORRELATION  CORRELATION     F-STAT     CHISQ-STAT      FLAG|
 |-------------------------------------------------------------------------------------| 
 |       CCIUTC       |  1|    0.9852  |    0.1374  |     2.7339 |     2.7917 |        | 
 |                    |---+------------+------------+------------+------------+--------| 
 |                    |  2|    0.9842  |    0.1114  |     0.7660 |     1.5867 |        | 
 |                    |---+------------+------------+------------+------------+--------| 
 |                    |  3|    0.9834  |    0.0778  |     0.8186 |     2.5803 |        | 
 |                    |---+------------+------------+------------+------------+--------| 
 |                    |  4|    0.9829  |    0.1047  |     0.7308 |     3.1165 |        | 
 |                    |---+------------+------------+------------+------------+--------| 
 |                    |  5|    0.9825  |    0.0926  |     0.7771 |     4.2043 |        | 
 |                    |---+------------+------------+------------+------------+--------| 
 |                    |  6|    0.9819  |    0.0868  |     0.7085 |     4.6695 |        | 
 |--------------------+---+------------+------------+------------+------------+--------| 
 |        LHUR        |  1|   -0.7236  |    0.0011  |     0.0000 |     0.0000 |        | 
 |                    |---+------------+------------+------------+------------+--------| 
 |                    |  2|   -0.7250  |    0.0364  |     1.4136 |     2.9282 |        | 
 |                    |---+------------+------------+------------+------------+--------| 
 |                    |  3|   -0.7268  |    0.0759  |     2.4246 |     7.6428 |       *| 
 |                    |---+------------+------------+------------+------------+--------| 
 |                    |  4|   -0.7293  |    0.0751  |     2.1621 |     9.2208 |       *| 
 |                    |---+------------+------------+------------+------------+--------| 
 |                    |  5|   -0.7312  |    0.1045  |     2.1148 |    11.4422 |       *| 
 |                    |---+------------+------------+------------+------------+--------| 
 |                    |  6|   -0.7326  |    0.1365  |     1.9614 |    12.9277 |       *| 
 |--------------------+---+------------+------------+------------+------------+--------| 
 |       FSPCON       |  1|    0.9484  |    0.0431  |     0.2631 |     0.2687 |        | 
 |                    |---+------------+------------+------------+------------+--------| 
 |                    |  2|    0.9481  |    0.0029  |     0.6758 |     1.3998 |        | 
 |                    |---+------------+------------+------------+------------+--------| 
 |                    |  3|    0.9483  |   -0.0266  |     0.4383 |     1.3817 |        | 
 |                    |---+------------+------------+------------+------------+--------| 
 |                    |  4|    0.9484  |   -0.0360  |     0.9219 |     3.9315 |        | 
 |                    |---+------------+------------+------------+------------+--------| 
 |                    |  5|    0.9494  |   -0.0793  |     0.9008 |     4.8739 |        | 
 |                    |---+------------+------------+------------+------------+--------| 
 |                    |  6|    0.9492  |   -0.0999  |     0.9167 |     6.0421 |        | 
 --------------------------------------------------------------------------------------- 

Integration of Economic Information in Credit Scorecard

The incorporation of economic information in the credit scorecard has been researched extensively in the academic world and started to receive increasing attention in the banking industry since the most recent global economic recession.

To our knowledge, the conventional usage of economic information in the credit scorecard is mostly for the segmentation purpose, e.g. to segment the business footprint into couple geographic regions based upon the economic heterogeneity. However, scorecard models are still developed solely on the information of credit profile and payment history. In our view, this is a static approach without the consideration of economic dynamics.

During the course of 2008 recession, most lending organizations have observed performance decay in their scorecards as a result of the economic downturn. Three major remedies for scorecard deterioration had taken place with the incorporation of economic information. First of all, a quick patch considered by most banks was to tighten up credit policies by increasing scorecard cutoffs in stressed areas based on their economic conditions, e.g. unemployment rates and housing price changes. Secondly, hybrid risk models were developed in many risk workshops by combining existing scorecards with economic data in order to restore the rank order capability and expected odds ratio. Thirdly, with the most recent credit profiles and payment behaviors of customers during the downturn, many scorecards were re-developed so as to guard against the rapid increases in non-performing loans and credit losses. Whilst approaches described above are able to address scorecard performance issues in a timely manner, they are still considered short-term treatments after the occurrence of recession and often tend to over-correct the underlying problems at the cost of missing revenue opportunities. Consequently, these approaches are inevitably subject to future adjustments or replacements in the economic recovery.

In light of the above discussion, a question raised is how we can effectively take advantage of economic information to improve the predictability and stability of scorecards through the economic cycle. Based upon our experience, a sensible resolution is to overlay economic data on top of the traditional scorecard development procedure by directly using economic indicators as model predictors. While the most predictability of a scorecard would still come from individual-level credit characteristics, economic indicators are able to complement credit attributes and to provide additional predictive lift to justify their values. For instance, given two individuals with identical risk profiles but living two MSAs with different economic outlooks, it is obvious that the one in a stressed local economy is more likely to become delinquent. Despite the predictability, a scorecard developed with a built-in economic trend is more robust and able to fluctuate automatically along with the cycle, reducing the necessity of scorecard adjustments in the dynamic economy. In addition, the inclusion of leading indicators or economic projections in the scorecard enables us to have a forward-looking prediction capability, which provides us an opportunity to proactively employ early interventions and preventions in loss recovery and mitigation initiatives.

Modeling Practices of Loss Forecasting for Consumer Banking Portfolio

Roll Rate Models

The roll rate model is the most commonly used modeling practice for the loss forecasting in the consumer banking arena built at the portfolio level instead of at the individual account level.

In this modeling practice, the whole portfolio is segmented by various delinquency buckets, e.g. Current, 30-DPD, 60-DPD, 90-DPD, 120-DPD, 150-DPD, and charge-off. The purpose is to evaluate the probability of an account in a specific delinquency bucket flowing into the next stage of delinquency status during the course of 1 month. The table below demonstrates the scheme of a basic roll rate model. In the table below, projected rolling rates are shown in the bottom two rows highlighted in red. The projected rate for each delinquency bucket is simply the moving average of previous 3 months.

Due to its nature of simplicity, the roll rate model is able to fit into various business scenarios, e.g. delinquency tracking and loss forecasting, and across different consumer products, e.g. installment loans and revolving credits. However, since the rolling rate for a specific delinquency bucket is estimated on the moving-average basis without being able to incorporate exogenous risk factors and economic drivers, a roll rate model is most applicable to the short-term loss forecasting, e.g. usually within 3 months, and also not able to estimate the portfolio loss in a stressed economic scenario.

Vintage Loss Models

A vintage loss model is another widely used modeling technique for the loss forecasting and is similar to the roll rate model in that they both are portfolio-based instead of account-based. However, in the vintage loss model, the whole portfolio is segmented by various origination vintages instead of delinquency buckets.

In this modeling practice, once the vintage criterion is determined, each delinquency performance, e.g. from 30-DPD through Charge-off, of every segment can be tracked over time through the full life cycle. For instance, in the case of loss estimation, the loss rate of a specific vintage can be formulated as

Ln(Loss_Rate / (1 – Loss_Rate)) = A * Vintage_Quality + B * Economy_Driver + S(Maturation)

In the model specification above, while vintage_quality, e.g. origination credit score or loan-to-value, and economy_driver, e.g. unemployment rate or housing price index, are linear components, Maturation, e.g. months on book, is a non-parametric term to reflect the nonlinearity of a maturity curve.

Compared with the roll rate model, the vintage loss model demonstrates a twofold benefit. First of all, with the inclusion of maturation information, the loss trend can be captured and utilized to improve the forecasting in a longer term. Secondly, incorporated with the economic information, the model can also be used to perform the stress testing in various economic scenarios. However, a caveat is that the vintage loss model is more suitable for installment loans than for revolving credits in loss forecasting due to impacts of various business practices such as balance transfers and teaser rates.

Expected Losses Models

Albeit easy to understand and simple to implement, two methods introduced above are all under the criticism of not being able to incorporate loan-specific characteristics and a finer level of economic information. Significantly different from roll rate models and vintage loss curves, expected loss (EL) estimation is a modern modeling practice developed on the basis of 3 risk parameters, namely probability of default (PD), exposure at default (EAD), and loss given default (LGD).

In this modeling practice, each risk parameter is modeled separately with account-level risk factors and economic indicators. For each individual account, the expected loss during the course of next 12 months can be formulated as

EL = PD * EAD * LGD

This modeling methodology not only is in line with Basel framework but also has following advantages over traditional methods for loss forecasting, including roll rate models and vintage loss models.

1. The account-level modeling practice provides a more granular risk profiling for each individual borrower.
2. Each risk parameter is driven by a separate set of economic factors independently, allowing a more dynamic view of economic impacts
3. The modeling methodology is in line with statistical techniques prevailing in the consumer lending arena and intuitively adoptable by most model developers.

Since this methodology heavily relies on statistical modeling concepts, the loss estimation is subject to specific statistical assumptions on distributions and functional forms.